Post on #Nifty 500 valuations wrt to its own history.
Why Nifty 500 and not Nifty50?
1) Because Nifty500 represents >95% mkt cap of India
2) Doesn't suffer from historical composition bias
As of 31st Dec20, the index has following statistical data.
Without adjustments the index on 31st Dec trading at PE of 43x / PB of 3.7x / Div Yield of 1.2%. Assuming a normal curve there represents following percentiles 100% (PE), 87% (PB) , 77% (Div Yield)
However earnings are depressed because of Covid. Current implied EPS is at ~265.
During Dec'19 the implied EPS was ~330. Assuming the same today the PE is at 34x ( 99%ile!!). Say the best case scenario that normalized EPS is 400 area, the PE would still be 29x (or 93%ile).
Clearly basis last 25 yr history markets today is top 5%-10% most expensive.
The risk reward appears unfavorable. Manage your asset allocations judiciously
Equity exposure should be reduced to reflect this reality. Even for most aggressive investors, the equity exposure shouldn't be more than 25-40%
• • •
Missing some Tweet in this thread? You can try to
force a refresh
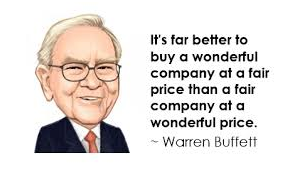
Indian Investors have converted this famous WB quote to buy “quality” at any price! IMHO this is one of the costliest incidences of Chinese whisper!!!!!
However today I look at #Jubilant FoodWorks which appears to be a fair company at absurd valuations
2/N
My observations basis limited history of 10 yrs
Positives
•Remarkable past execution (30 mins delivery)
•Excellent historical growth
•Great Return Ratios (ROCE, ROE)
•Reasonable growth expectations going forward
3/N
Negative
•Doesn’t own the brand!! (Risk of dispute not factored)
•Questionable Promoters (Tried to extract a royalty for using the “Jubilant” brand. This for a co. which pays royalty to use #Dominos brand!!)
•Growth Slowdown (from ~40% to ~15%)
•Decline in return ratios
Truman (ex US president) famously said “The only thing new in the world is the history you do not know”
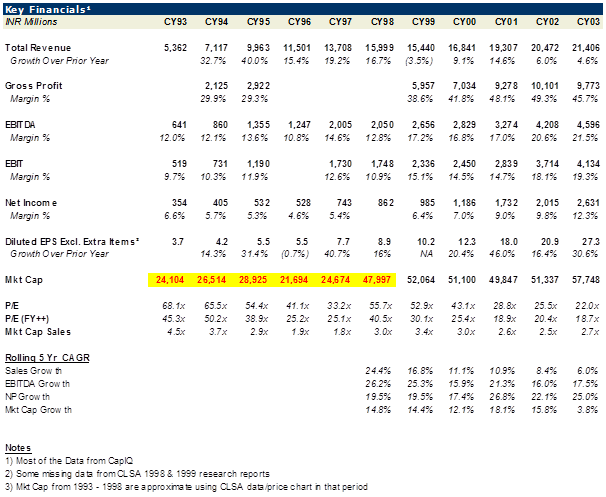
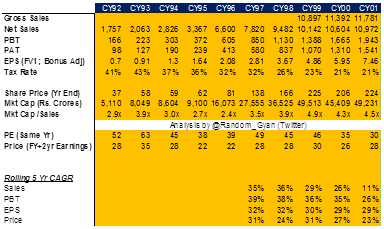
With that in mind, I look at #Nestle financial history in India since 1993 (27 yrs of History)
Period 1 - CY93-CY2003
Sales -14.8% (CAGR)
NP - 21.8%
Mkt Cap - (9.1%)
2/N
Observations - Returns between '93 and '03 were low because of 2 factors - Starting PE was very high and Ending PE was decade low
Period 2 - "CY04-CY13"
Sales - 15.5% (CAGR)
NP - 15.6%
Mkt Cap - 23.3%
Observations - High returns becasue of low starting PE
3/N
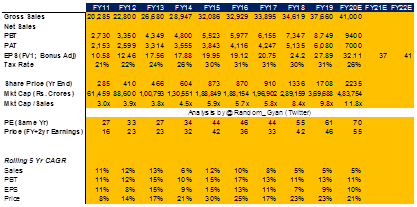
Period 3 - "CY13 onwards
Sales - 5.3% (CAGR)
NP - 9.9%
Mkt Cap - 23%!!!
Observation - Sales/Earnings slowing (Maybe GST, Maggi debacle) but Mkt cap continued to grow 10% extra every year) to reach historic highs. This is bad setup for future returns.
1. Mcap/sales (0.5-2x) 2. Market discounts next 10 yrs. To make decent money on absurd starting P/E , 10 yrs hence , markets estimate of another 10 yrs should be rosy. Effectively 20yrs of performance.
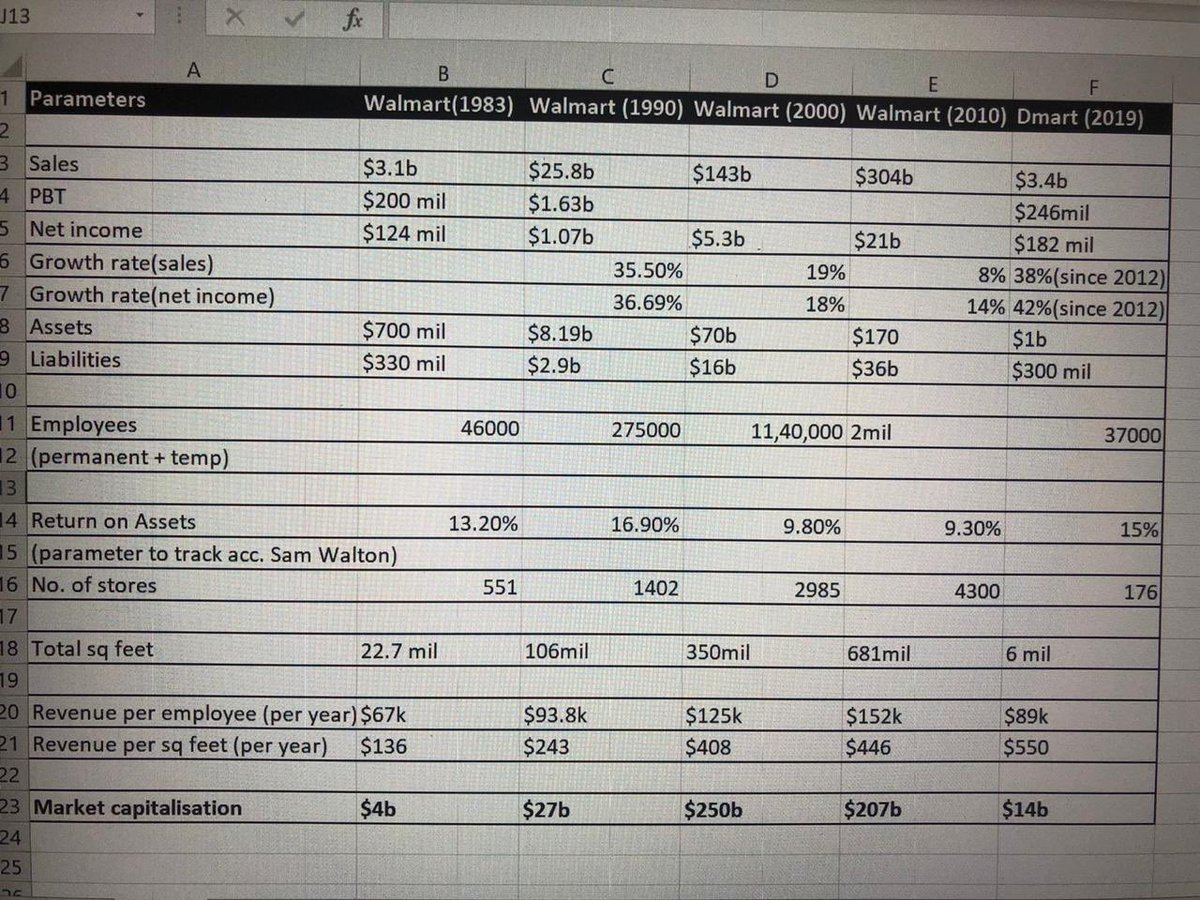
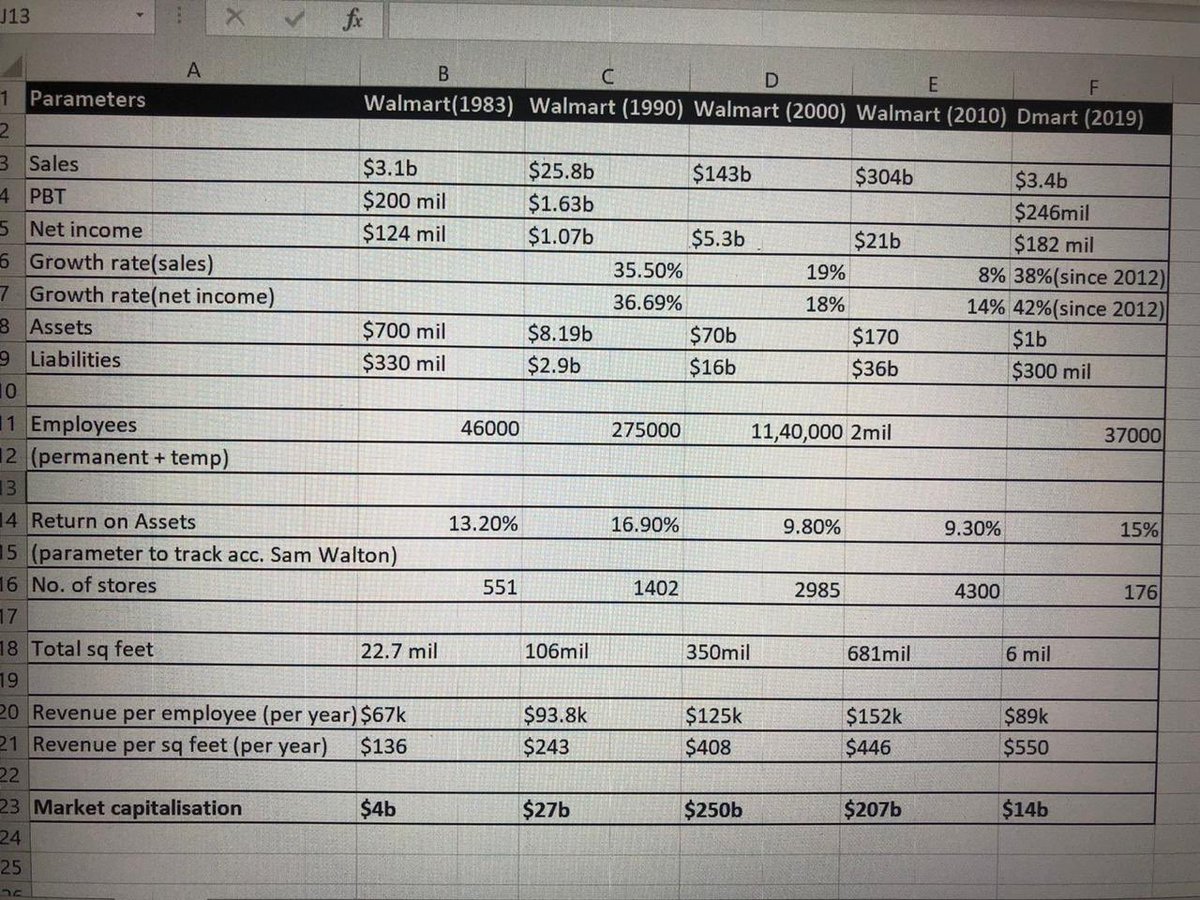
Dmart Investors - Assuming next 27 yrs is as good as walmart the returns will be 10.5% CAGR. Assuming 2x walmart CAGR is 13.4%
The best case scenario is medicore. or Head I loose, Tail I don't win much.
(This is inverted version of @MohnishPabrai saying)
Not saying you can't make a lot of money in High P/E growth companies.
You can as long as you know when to exit!!
Someone who has done this successfully is @BMTheEquityDesk who exited in Pantaloons, Bharti Airtel, Page etc in time.
For co's with stable cash flows (pricing power), starting PE is the biggest driver of future returns. Notice how between '92-'97 negative returns despite 25% p.a. profit Growth. Reverse was true between 2002-07. 27% p.a. returns despite 18% p.a. PAT growth
2/N
My speculation over the next 5-10 yrs
1. Cig+Hotels div profits grows 7% - 10% p.a. 2. FMCG profits to see J curve. Rev expectation of 50k - 70K with 10 -15% PAT margins (Management goal 1Lakh cr rev by '30) 3. Range of outcoumes from 25K (no FMCG J curve) - 40K profits
3/N
4. Dividend Payout ratio to remain 80-85% 5. Exit PE between 15x - 30x 6. Entry price of 180/- (Div of 9/- in May'20)