Where does #COVID19 rank in the most depressing league table of all - the one comparing historic pandemics? We won't know for sure until the pandemic is over but we do now have enough data to draw some early conclusions. I've done some digging into the numbers:
I should say that I began this process unsure of what I'd find. Back in the spring I looked back at historical weekly deaths figs and found that while the 2020 levels were horribly high (and unprecedented seasonally) some weeks of Hong Kong flu were worse.
https://twitter.com/edconwaysky/status/1252212873637572608?s=21
The weekly deaths numbers only go back so far. But we now have data for the 52 weeks of 2020 up to Christmas Day, which is enough to make a conservative estimate of how 2020 compares with history. And we have nearly two centuries of data to compare it to…
The @ONS’s brilliant @NickStripe_ONS went through some of the data in a must-read thread last wk but while mine might overlap somewhat it also goes a wee bit further, inc age-standardisation and also military deaths since there are lots of prisms through which to consider this
https://twitter.com/nickstripe_ons/status/1346860617735532544
The first point is that in terms of pure numbers of deaths, this is the worst year since 1918 - the final year of WWI and the Spanish Influenza. More than 600,000 people died in England & Wales in 2020. That's more than any year in WWII (inc military deaths). 
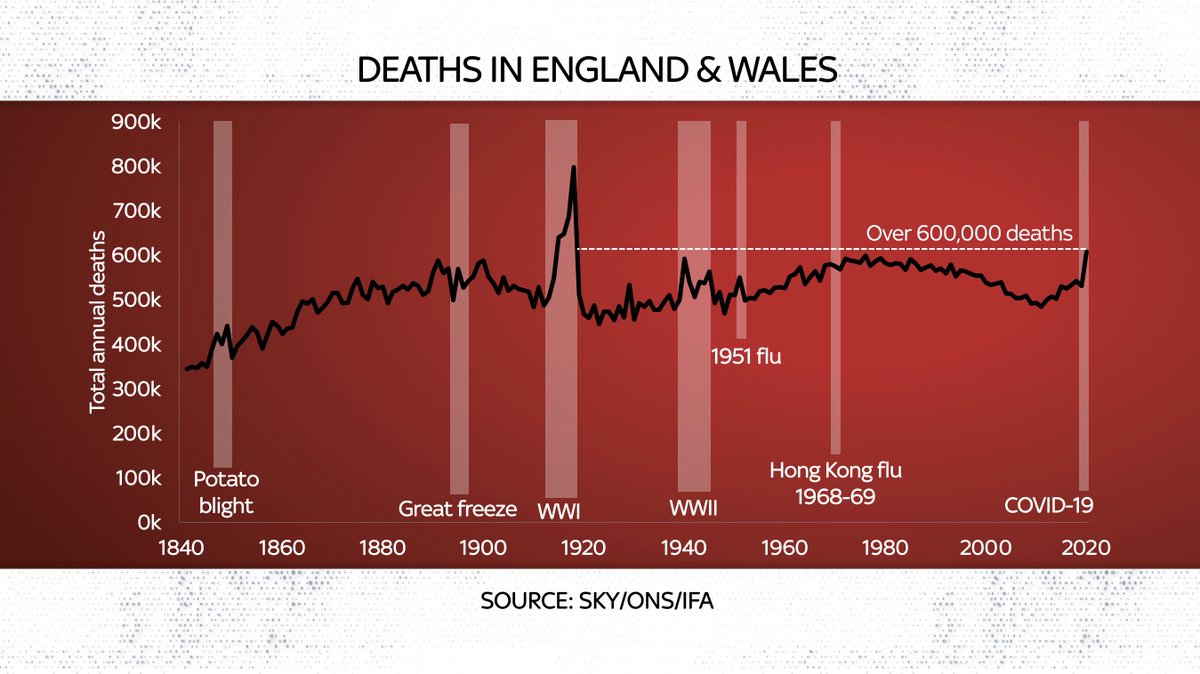
Now before you say anything: yes, awful & striking as that chart is, the line’s not really comparable since the population has grown enormously over that period. Here’s a population-adjusted version of the same chart: deaths per 1k. We’re “only” back up to 2003 levels. Good news?

Not really, since what matters here is the direction of travel. For most of the past century it’s been downwards. In 2020 it suddenly leapt in the other direction. One way of illustrating this is comparing each year to the previous five. Excess deaths. And here’s how that looks:
In 2020 the population-adjusted excess death rate was the highest since 1940. Higher than any postwar pandemic and matched in peacetime only by 1929 (severe flu pandemic and economic crash) and 1847 (potato blight and famine in parts of N Europe).

At this stage it’s prob worth underlining:
- These are not projections. They are deaths that have actually happened.
- These are deaths of ALL causes vs previous years, adjusted for population. So no quibbling over whether something is a #COVID19 death or not. This is everything.
- These are not projections. They are deaths that have actually happened.
- These are deaths of ALL causes vs previous years, adjusted for population. So no quibbling over whether something is a #COVID19 death or not. This is everything.
However an even more robust measure is age-adjusted mortality. I wasn’t able to calculate this myself but the brilliant @ActuaryByDay & colleagues at @actuarynews are. Here’s the long view of age-adjusted mortality. Again, tho, better to look at changes than levels (next tweet)
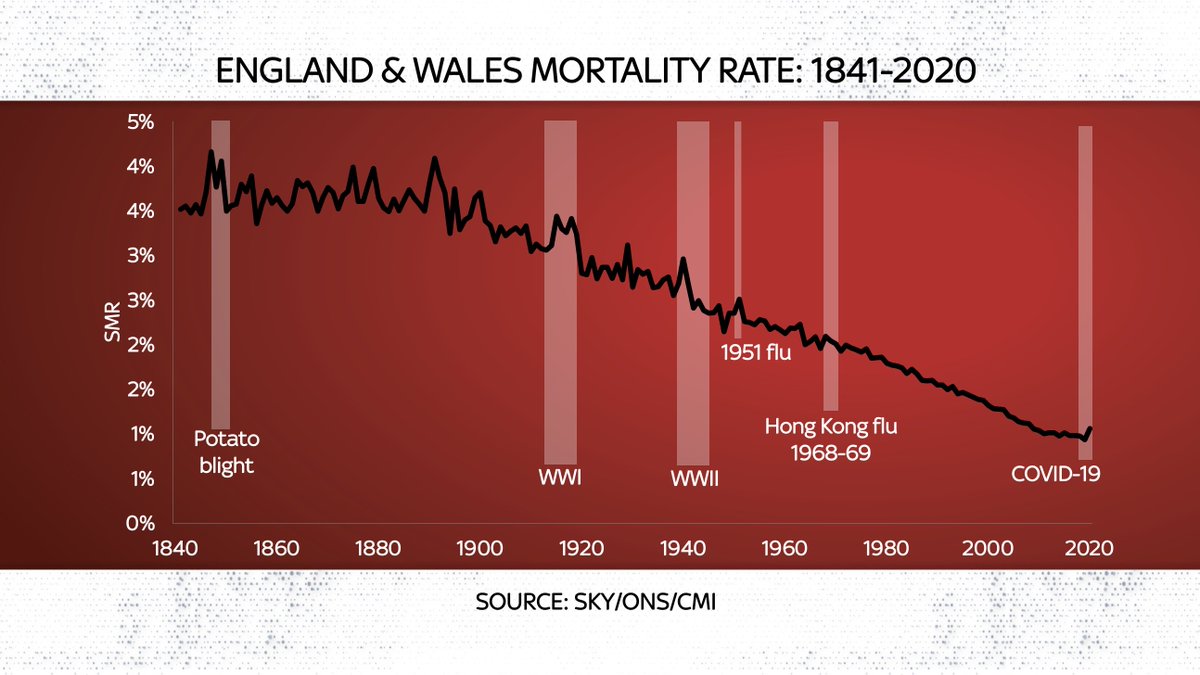
This is one of the most shocking charts I’ve ever posted. It plots annual changes in the Eng/Wales mortality rate.
In 2020 it deteriorated (eg more people died vs the prev yr in population & age-adjusted terms) than any year since 1929.
Awful.
In 2020 it deteriorated (eg more people died vs the prev yr in population & age-adjusted terms) than any year since 1929.
Awful.

In case that chart wasn’t clear, I’ve picked out each of the worst years for changes in annual age-adjusted mortality going back to 1840. These are civilian deaths only.
2020 was the third worst year in recorded history. Worse than any post-war pandemic. Much worse.
2020 was the third worst year in recorded history. Worse than any post-war pandemic. Much worse.

Now, when I started out on this exercise I confess I still wasn’t sure whether 2020 would prove worse in mortality terms than some other post-war pandemics. After all, we had a lockdown; they didn’t. But it turns out even in spite of lockdown, this has been much, much, much worse
As I hope I’ve shown, there is no definitive measure for the scale of this pandemic. There are other prisms beyond even these 👆. And the pandemic is ongoing so the full toll is unknown. But on almost every metric, the mortality change in 2020 was disastrously bad.
Q: Was 2020 the worst year for mortality in England & Wales since:
a) 2003
b) 1940
c) 1929
d) 1918
As you'll see from this thread and this piece on the @SkyNews website, the answer is: all of them news.sky.com/story/covid-19…
a) 2003
b) 1940
c) 1929
d) 1918
As you'll see from this thread and this piece on the @SkyNews website, the answer is: all of them news.sky.com/story/covid-19…
Yes I too was surprised by how little the HK flu showed up. Might to some extent reflect that it was spread over 2yrs. Underlining my point that there's really no definitive measure of these things. We need to bear a number of yardsticks in mind. 2020 looks rotten by most of them
https://twitter.com/ianpocock/status/1348732292307578883
Another prism is to look at total deaths "due" to each pandemic (tho we get into diagnosis difficulties here). Eg:
- Spanish Flu: c 200k in UK
- Asian Flu 1957-58: c. 33k
- HK flu 1968-69: c. 80k
- #COVID19: 82k and counting.
But this prism lacks age & population adjustment
- Spanish Flu: c 200k in UK
- Asian Flu 1957-58: c. 33k
- HK flu 1968-69: c. 80k
- #COVID19: 82k and counting.
But this prism lacks age & population adjustment
How does #COVID19 rank in mortality terms versus other pandemics - and indeed wars - through history? We now have enough data to begin to answer the question. Here’s my video explaining some of that data. More detail in the article and thread 👆
Useful blog from the @ONS adding further detail on how 2020 mortality compares historically blog.ons.gov.uk/2021/01/12/cou…
In case you're wondering why some people are saying 2020 was the worst year for deaths since 1940 and others the worst since 1929 (and others still only the worst since 2003), you'll find the answer in this article (and also the thread ☝️) news.sky.com/story/covid-19…
• • •
Missing some Tweet in this thread? You can try to
force a refresh