1/ Trend Factor: Any Economic Gains from Using Information over Investment Horizons? (Han, Zhou, Zhu)
"A trend factor using multiple time lengths outperforms ST reversal, momentum, and LT reversal, which are based on the three price trends separately."
papers.ssrn.com/sol3/papers.cf…
"A trend factor using multiple time lengths outperforms ST reversal, momentum, and LT reversal, which are based on the three price trends separately."
papers.ssrn.com/sol3/papers.cf…
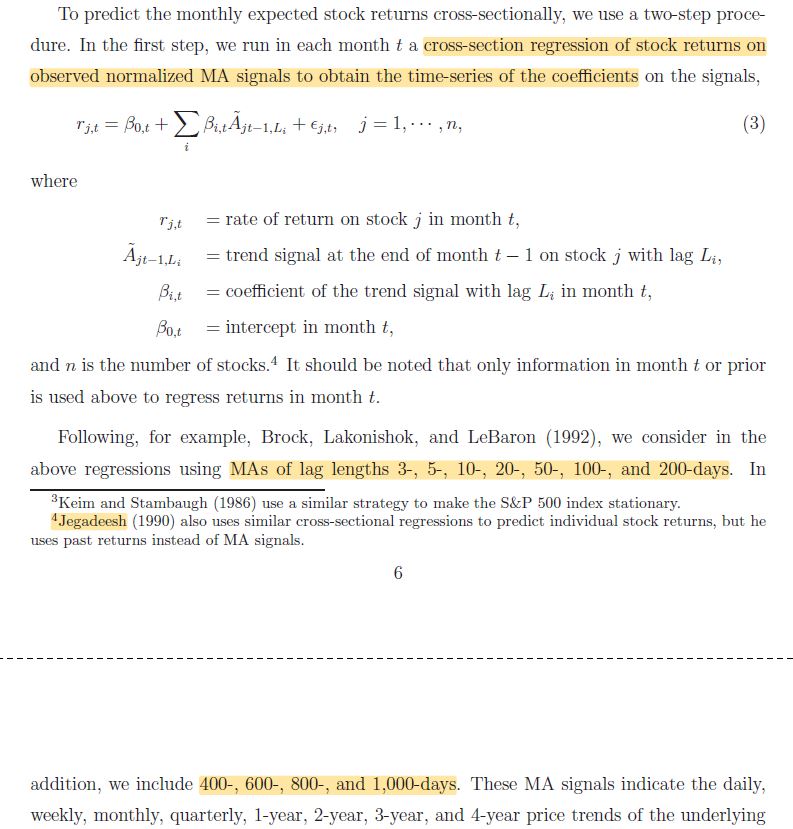
2/ This resembles combining multiple measures of ST reversal, momentum, and LT reversal (forecasts determined by walking forward rather than using signs from the full sample).
Unlike normal moving average signals, these are *cross-sectional.* More below:
Unlike normal moving average signals, these are *cross-sectional.* More below:
https://twitter.com/ReformedTrader/status/1141106490083692544


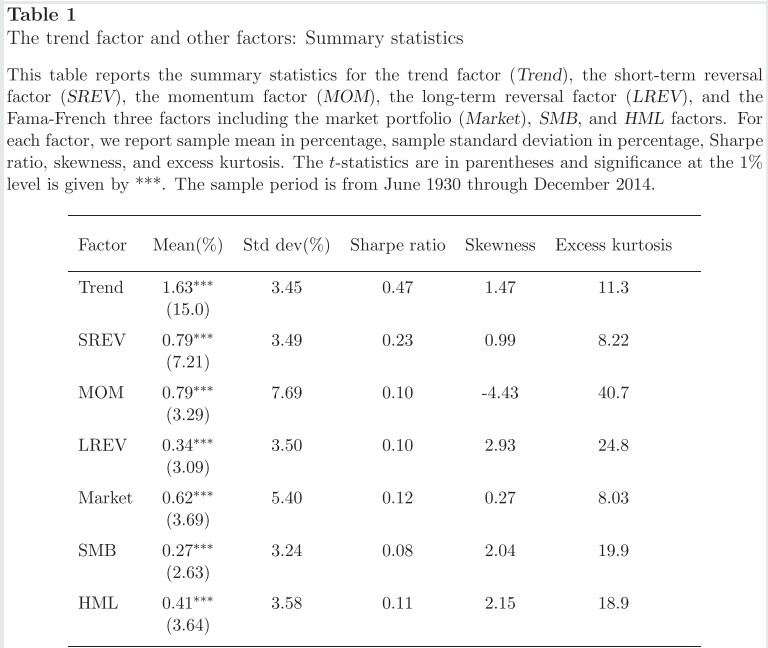
3/ Unsurprisingly, the Trend factor formed by this approach outperforms benchmarks in terms of both Sharpe ratio and tail metrics. It's combining momentum with two factors that are negatively correlated to it AND using multiple specifications.
More here:
More here:
https://twitter.com/GestaltU/status/1110908075333038081
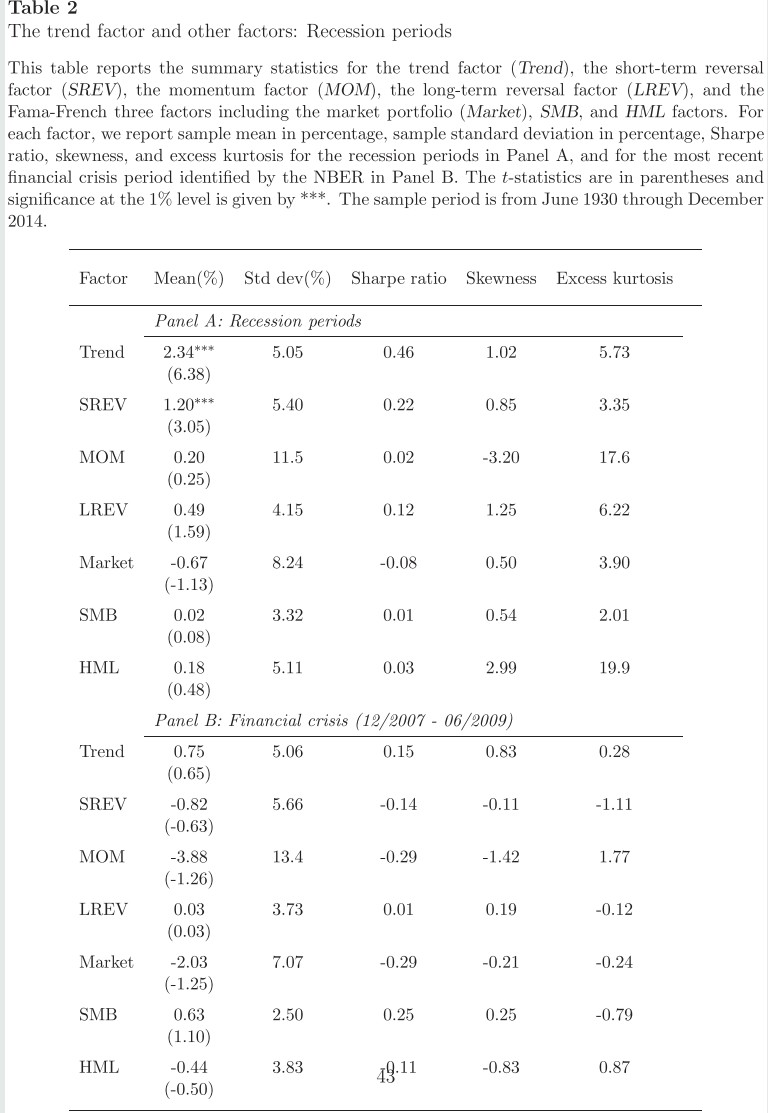
4/ "Average return and volatility of the trend factor are both higher in recession periods. However, the Sharpe ratio is virtually the same.
"Interestingly, all of the factors still have positive average returns.
"Momentum experiences the greatest increase in volatility."
"Interestingly, all of the factors still have positive average returns.
"Momentum experiences the greatest increase in volatility."
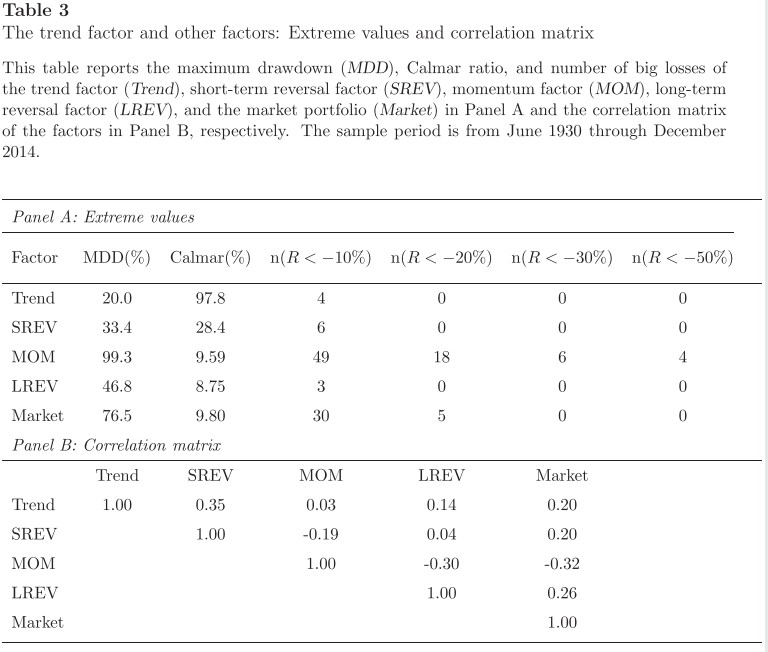
5/ "In terms of maximum drawdown and the Calmar ratio, the trend factor performs the best.
"The trend factor is correlated with the short-term reversal factor (35%), long-term reversal factor (14%), and the market (20%) but is virtually uncorrelated with the momentum factor."
"The trend factor is correlated with the short-term reversal factor (35%), long-term reversal factor (14%), and the market (20%) but is virtually uncorrelated with the momentum factor."
6/ "The trend factor has a higher return during recessions, while momentum earns a small positive return b/c the short leg is a bit more negative than the long leg. Similar conclusions hold for expansions. This is why the two factors are not correlated over the entire sample."


7/ "The trend factor outperforms the momentum factor not only in terms of average returns, but also in terms of downside risks during months when the momentum factor performs poorly."


8/ "The hypothesis is strongly rejected that the trend factor is inside the mean-variance frontier of the short-term reversal, momentum, and long-term reversal factors for all three periods."


9/ "Overall, the trend factor, which utilizes price information across all the investment horizons, seems to place more emphasis on short-term price patterns than on the intermediate and long-term ones."


10/ Table 9: "While the market beta and SMB beta are U-shaped, the HML beta is hump-shaped across the quintiles. Hence, the trend factor has a small loading on the market and insignificant SMB and HML betas in the Fama-French three factor model."


11/ "The results suggest that small stocks and low priced stocks are more trending. This may be intuitively true: large stocks have more analyst following and more investors, and hence more information transparency and faster price movements to reflect available information."


12/ "A certain smoothing of the betas is necessary to maintain the out-of-sample performance of the trend factor.
"The betas do change substantially over time, varying from positive values to negative ones."
"The betas do change substantially over time, varying from positive values to negative ones."


13/ "Performance decreases as the market size increases. However, even for the largest stocks, the superior performance of the High-Low spread portfolio is stat. & economically significant.
"Performance remains largely unchanged after controlling for other firm characteristics."
"Performance remains largely unchanged after controlling for other firm characteristics."


14/ "ER12trd has a significant and positive coefficient, indicating that the trend signals can predict future cross section returns independent of size and B/M. This is consistent with Table 11.
"Similar results are obtained when other variables are added to the regression."
"Similar results are obtained when other variables are added to the regression."

15/ "It is not an easy matter to short all the stocks in the short leg.
"We have to have detailed information on which stocks can be shorted and then estimate the costs. While our evaluation based on the BETCs shows profitability potential, it is limited in scope."
"We have to have detailed information on which stocks can be shorted and then estimate the costs. While our evaluation based on the BETCs shows profitability potential, it is limited in scope."

16/ "The performance of the trend factor is not driven by a few outliers but is remarkably stable over time.
"Our trend factor passes the higher bar given in Harvey, Liu, and Zhu (2016) easily with a t-statistic of 13.6 (the momentum has a value of 6.04)."
"Our trend factor passes the higher bar given in Harvey, Liu, and Zhu (2016) easily with a t-statistic of 13.6 (the momentum has a value of 6.04)."

17/ "The trend factor is clearly valid internationally, yielding the best performance among all the three factors and the local market indexes."


18/ "Table 15 reports the performance of the trend forecasts under different levels of information uncertainty.
"The Fama-French alphas increases as information uncertainty increases."
"The Fama-French alphas increases as information uncertainty increases."

19/ "The trend factor performs better in explaining the industry returns than the momentum factor.
"The trend factor improves performance in terms of explaining the cross-section returns of the six size and book-to-market portfolios."
"The trend factor improves performance in terms of explaining the cross-section returns of the six size and book-to-market portfolios."


20/ "While the momentum factor together with the CAPM is far from sufficient in explaining the hedge fund returns, the trend factor performs still slightly better than the momentum factor in that task."


21/ "While our methodology here is focused on using price trends across investment horizons, it can also be applied to examine other economic fundamentals, such as firm earnings, profitability, growth, and investment patterns, over short and long terms."
22/ Related research:
Industry Long-Term Return Reversal
Industry Long-Term Return Reversal
https://twitter.com/ReformedTrader/status/1116523225884708864
• • •
Missing some Tweet in this thread? You can try to
force a refresh