THREAD: Sports Utility Vehicles (SUVs)

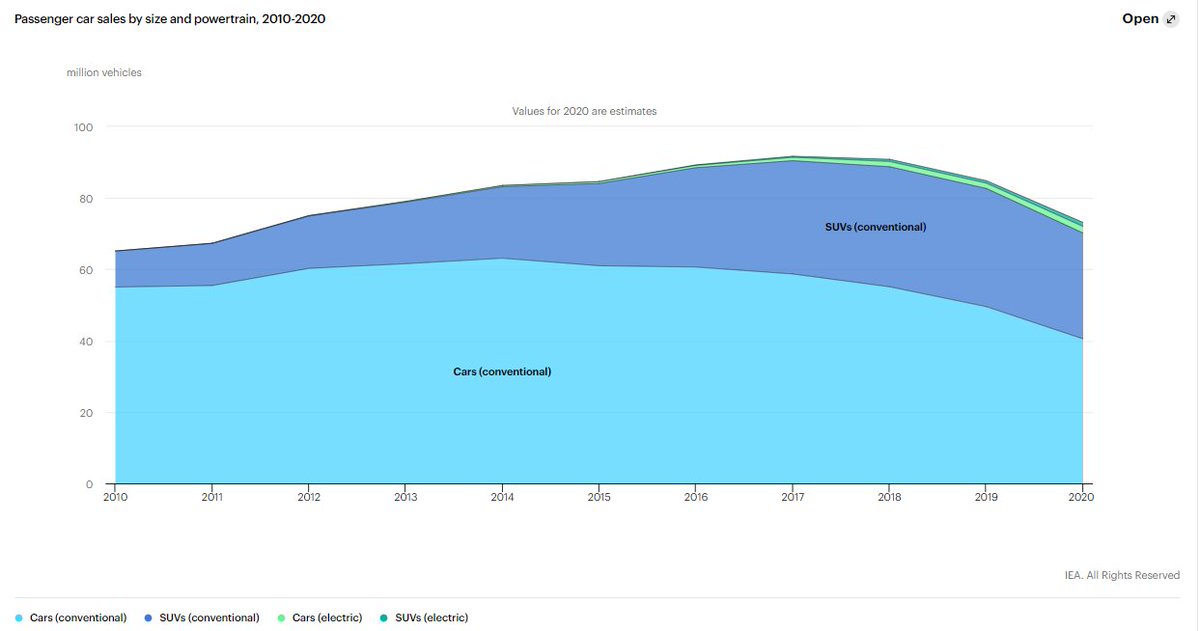
Global car sales shrank by ~14% in 2020
* Sales of electric cars grew ~50% (from a very low level)
* Sales of SUVs declined ~10%, but share of sales went from 39% to 42%

→ What about emissions from SUVs?

1/

iea.org/commentaries/c…
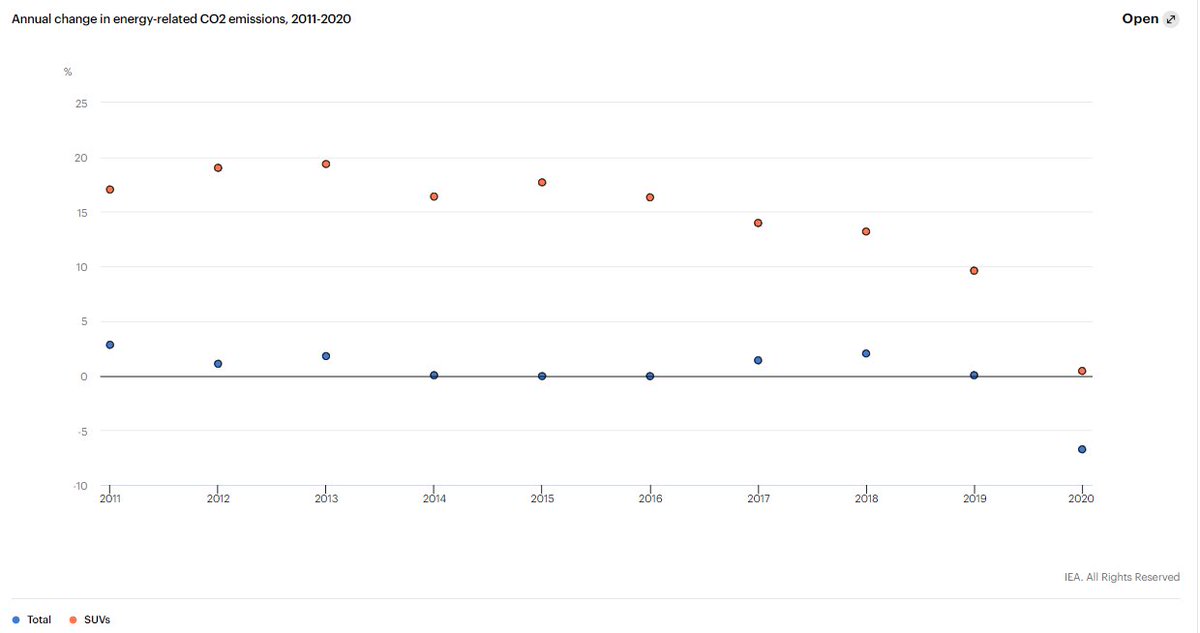
Emissions from SUVs are estimated to have seen a slight increase of 0.5% in 2020, despite global emissions down ~7%.

"Despite the effects of the pandemic on overall car use, SUVs consumed more oil last year than they did in 2019"

2/
"Oil consumption from SUVs reached 5.5 million barrels per day in 2020"

"Remarkably, we estimate that the increase in the overall SUV fleet in 2020 cancelled out the declines in oil consumption by SUVs that resulted from Covid-related lockdown measures"

3/
"SUV emissions are comparable to those of the entire maritime industry, including international shipping"

"Emissions from SUVs have nearly tripled over the past decade"

4/
"we estimate that the reduction in oil demand from the increased share of electric vehicles in the overall car market in 2020 – around 40,000 barrels a day – was completely cancelled out by the growth in SUV sales over the same period."

5/
"An estimated 9 million people delayed the replacement of their old car, and the prolonged use of these older, less-efficient vehicles increased oil demand by 50,000 barrels a day in 2020, according to IEA analysis."

6/
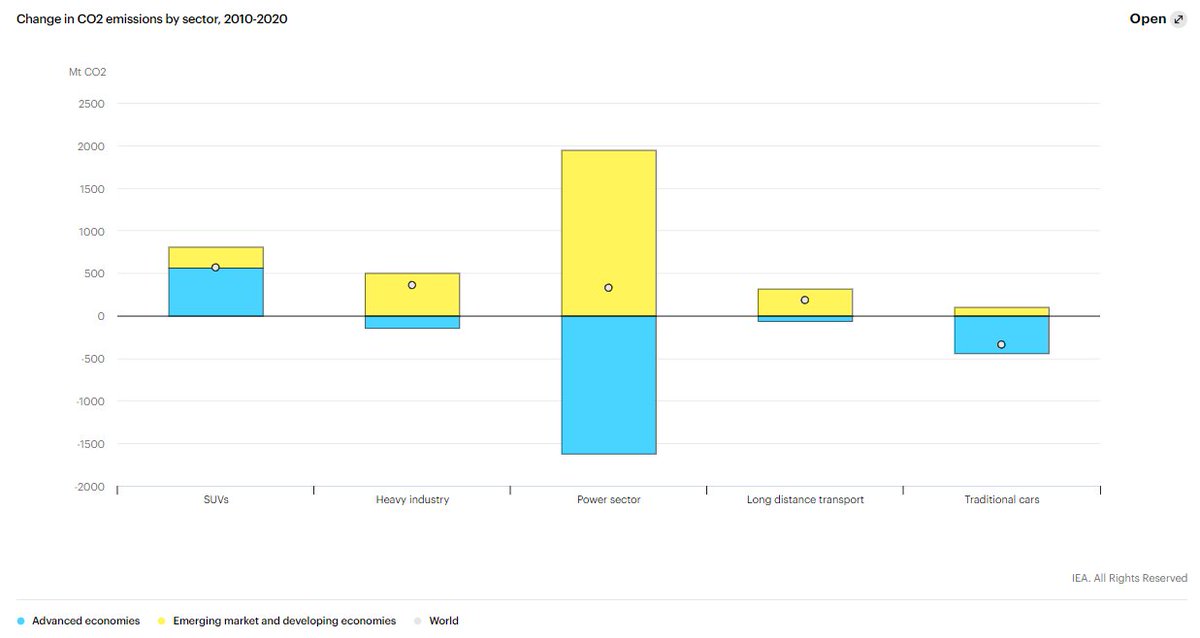
"Over the past decade, SUVs were the only area of energy-related emissions growth in advanced economies, adding 300 Mt CO2. Across all other sectors of the economy and other forms of transport, carbon emissions remained flat or declined."

7/
And shifting to electric SUVs does not help much, as it puts more demand on resources: "The strong consumer preference for SUVs has implications for clean energy transitions more broadly, notably in terms of electricity demand, batteries and raw materials."

8/
Worth reading this post by @Laura_Cozzi_ & @ApostolosPetro1. It contains some rather concerning statistics...
iea.org/commentaries/c…

9/9

• • •

Missing some Tweet in this thread? You can try to force a refresh
 

Keep Current with Glen Peters

Glen Peters Profile picture

Stay in touch and get notified when new unrolls are available from this author!

Read all threads

This Thread may be Removed Anytime!

PDF

Twitter may remove this content at anytime! Save it as PDF for later use!

Try unrolling a thread yourself!

how to unroll video
  1. Follow @ThreadReaderApp to mention us!

  2. From a Twitter thread mention us with a keyword "unroll"
@threadreaderapp unroll

Practice here first or read more on our help page!

More from @Peters_Glen

19 Jan
To say "the remaining carbon budget for 1.5°C is 440 GtCO₂" [add favorite number] is highly misleading

Taking a narrow 67–33% range, the value is 230–670 GtCO₂, but full range (left) could be −1000 - 2000 GtCO₂... (yes, could be negative or huge)

1/

nature.com/articles/s4324… Image
When I wrote "studies ranging from −100 to about 800 GtCO₂" back in 2018 I was being very conservative (there were no full uncertainty analyses then) rdcu.be/bHT2C

Good to see papers (now) being much more explicit about the uncertainty & range...

2/
I have problems with the remaining carbon budgets presented as a single number, instead of a range. Is there any other climate variable presented as a one-sided probability? The ECS, eg, is presented as a range.
rdcu.be/bHT2C

Good to see the authors use ranges!

3/ ImageImage
Read 6 tweets
23 Dec 20
1. Oil & gas companies still expect the world to consume large quantities of oil & gas in 2050. That view would seem to put the oil giants in conflict with the IPCC.

𝐈𝐧 𝐟𝐚𝐜𝐭, 𝐭𝐡𝐞 𝐨𝐩𝐩𝐨𝐬𝐢𝐭𝐞 𝐢𝐬 𝐨𝐟𝐭𝐞𝐧 𝐭𝐫𝐮𝐞...

@bstorrow eenews.net/climatewire/st…
2. [O]il companies & the IPCC alike rely on a contentious strategy known as negative emissions — the practice of pulling carbon dioxide out of the atmosphere. In theory, NETs would buy the world a little more time to phase out the use of fossil fuels ...
3. "[N]one of these models are forecast machines" @DetlefvanVuuren

"It's just an element, a tool to explore different trajectories on the basis of the knowledge we have today & to see what ... might encounter."

Both critics & modelers agree such nuance is often lost
Read 20 tweets
22 Dec 20
1. Integrated Assessment Models (IAMs) often assume the same carbon prices in each region (left, orange dots): this is efficient but leads to large inequities (right).

More equitable distributions of carbon prices (left, blue dots) is less efficient.

doi.org/10.1038/s41586…
2. @NB_pik addresses this problem in a new paper: "The core finding of this research is the strongly nonlinear trade-off between cost-efficiency and sovereignty in achieving the long-term PA climate target in an equitable way."

Small changes to efficiency have big equity gains.
3. The gaps between uniform & differentiated carbon prices (first tweet) was modified to create the trade-off curve (previous tweet). This was done by applying an exponential function to adjust pairs of regional prices.

Is the "core finding" dependent on the "exponential"?
Read 10 tweets
22 Dec 20
Some updated carbon budgets from @CONSTRAIN_EU
→ 5 years left for 66% <1.5°C (HT @rtmcswee)

To what degree should we look at 66% <1.5°C?
* According to the 2018 #SR15, there are no scenarios 66% <1.5°C
* Huge gap between 50% 1.5°C & 66% 2°C (~1.7-1.8°C)

constrain-eu.org/publications/z…
We have become so obsessed with these arbitrary lines at 1.5°C & 2°C, but I think the more relevant point, is that there is a HUGE gap between 1.5°C & 2°C.

While 1.5°C might be too late, there is still lots to fight for.

Every 0.1°C is ~200GtCO₂!

cicero.oslo.no/no/posts/klima…
A slight technical point. 66% <1.5°C is probably around 1.3-1.4°C for 50%. We are at ~1.2°C today, so a 0.1°C increase or 200GtCO₂ is quite consistent with the remaining budget for 66% <1.5%...

[The 0.1°C ~ 200GtCO₂ is based on the TCRE, see link in previous tweet]
Read 4 tweets
21 Dec 20
Given all the 𝗳𝗶𝗿𝗲𝘀 around the world, some might be surprised that the CO₂ emissions from land-use change in 2019 & 2020 are not too anomalous.

Why? Only the fires in the Amazon & SE Asia were from land-use change.

1/
globalcarbonproject.org/carbonbudget/i… Image
The big fires in Australia, Arctic, & California were 'natural' & not a consequence of land-use *change*.

Those fires result in either higher atmospheric concentrations or a weaker land sink (bottom left) & not bigger land-use change (top left).

Bottom right is net land.

2/ Image
We can measure the increase in the atmospheric concentration quite accurately, it is a matter or partitioning the CO₂.

Fires either go into land-use or land-sink, depending on cause. This is more an accounting (definition) convention.

All very complex...

3/ Image
Read 4 tweets
11 Dec 20
1. What happened to EU27 emissions in 2020 & what does it mean for the 55% 2030 target?

COVID19 sent CO₂ emissions down ~12%:
* Coal went down 18% in 2019, COVID cements this in
* Oil has grown last 5 years, 2020 needs to start a new decline
* Gas is stubborn, problem for 2030!
2. The EU target is for GHGs (not just CO₂), but now includes the forest sink.

The inclusion of the sink makes the relative reduction in emissions from 1990 larger (24% to 2018) & makes a 2030 target easier to achieve (in terms of reduced growth rates to achieve it).

But...
3. The inclusion of the land sink is probably necessarily to meet the 2050 net-zero GHG emission goal.

It may be hard to maintain the land sink, particularly in the face of climate change.

The alternative is using technical carbon removal (BECCS or DACCS, which have troubles).
Read 5 tweets

Did Thread Reader help you today?

Support us! We are indie developers!


This site is made by just two indie developers on a laptop doing marketing, support and development! Read more about the story.

Become a Premium Member ($3/month or $30/year) and get exclusive features!

Become Premium

Too expensive? Make a small donation by buying us coffee ($5) or help with server cost ($10)

Donate via Paypal Become our Patreon

Thank you for your support!

Follow Us on Twitter!