Bitcoin blocks are like container ships.
You may have heard this metaphor before, but the details are fun to consider. It also helps explain Bitcoin's path to scaling up to handle the entire world's transactions.
A thread...
You may have heard this metaphor before, but the details are fun to consider. It also helps explain Bitcoin's path to scaling up to handle the entire world's transactions.
A thread...

In 2019, 802M containers were shipped.
A large container ship holds 8,000 containers. If an average one holds 4,000 containers, this means ~200k container ship journeys per year.
Bitcoin has ~210k blocks per year.
Sources: statista.com/statistics/913…, worldshipping.org/benefits-of-li…
A large container ship holds 8,000 containers. If an average one holds 4,000 containers, this means ~200k container ship journeys per year.
Bitcoin has ~210k blocks per year.
Sources: statista.com/statistics/913…, worldshipping.org/benefits-of-li…

The revenue generated by a container ship journey is the sum of fees charged for ~4,000 individual containers.
When new Bitcoin issuance fades away in the coming decades, the revenue generated by a Bitcoin block will be fees from ~2,000 transactions.
bitcoinvisuals.com/chain-tx-block
When new Bitcoin issuance fades away in the coming decades, the revenue generated by a Bitcoin block will be fees from ~2,000 transactions.
bitcoinvisuals.com/chain-tx-block
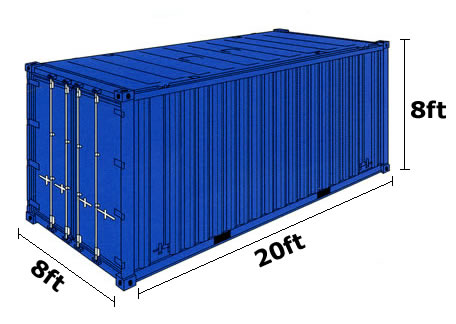
There is 1,280 cubic feet of space in each container. That's enough to comfortably fit a car.
But usually, a container carries more than one item. The space is large enough for 100 washing machines, or 12,000 stuffed animals.
But usually, a container carries more than one item. The space is large enough for 100 washing machines, or 12,000 stuffed animals.
The cost to ship one container from Shanghai to Los Angeles is ~$1,200.
That means $1,200 per car, or $0.1 per stuffed animal.
Similarly, the fee for a Bitcoin transaction can be shared across many inputs (what exchanges do) or by settling many Layer 2 transactions.
That means $1,200 per car, or $0.1 per stuffed animal.
Similarly, the fee for a Bitcoin transaction can be shared across many inputs (what exchanges do) or by settling many Layer 2 transactions.
Even if an average Bitcoin on-chain transaction fee ends up costing a whopping $1,200, but represents the settling of 12,000 constituent transactions, the fee per transaction is $0.1.
Visa makes ~$22B in revenue on ~185B annual transactions, or $0.12 per transaction.
Visa makes ~$22B in revenue on ~185B annual transactions, or $0.12 per transaction.
In the above scenario, the total fees per block would amount to $2.4M.
That's roughly 10x the value of the newly mined Bitcoin in each block today (6.25 x $35k = $220k).
Put another way, to maintain today's mining industry, need 1/10th the revenue of container ship industry.
That's roughly 10x the value of the newly mined Bitcoin in each block today (6.25 x $35k = $220k).
Put another way, to maintain today's mining industry, need 1/10th the revenue of container ship industry.
In summary,
Bitcoin block = container ship
On-chain transaction = container
Many tx inputs = many smaller items inside container
Fee market will develop fine, like a global shipping industry for digital value.
Bitcoin block = container ship
On-chain transaction = container
Many tx inputs = many smaller items inside container
Fee market will develop fine, like a global shipping industry for digital value.
Edit: Whoops, 210,000/4 blocks per year. Don't multitask and Tweet thread y'all
Overall story remains the same though
Overall story remains the same though
• • •
Missing some Tweet in this thread? You can try to
force a refresh