1/_ Interactive #GIS map showing risk of #DebisFlow for wildland fires. For the legend and to get the most benefit from the map, please click “Map tips” in upper left corner. To search on address click Menu > Search. #CAwx

Open #GISsurfer map: bit.ly/39Y5BRA Image
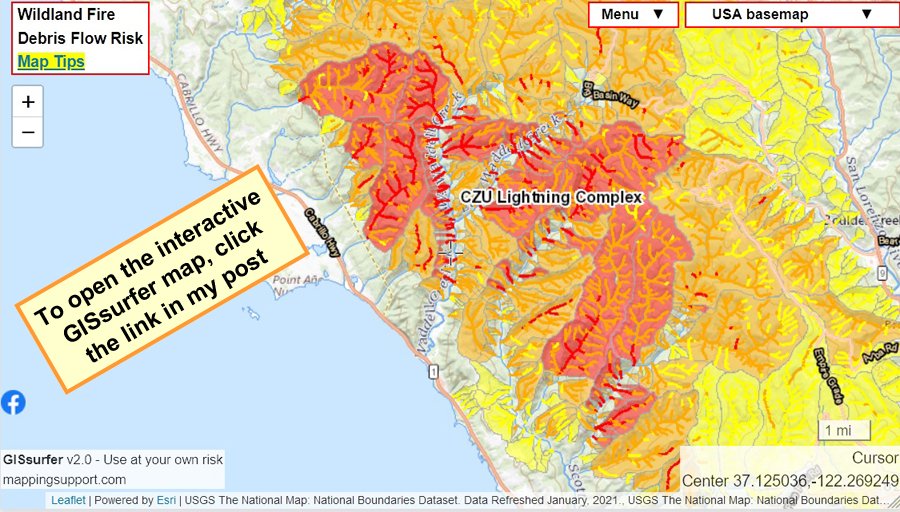
2/_ The map opens at the #CZULightningComplex. You can pan the map to other 2020 fires and see the same type of data. Be patient! The map might be slow to refresh. It depends in part on how much other work the GIS server is doing.
3/_ The map can display the risk of debris flow for fires back to 2017. Here is one way to make a map to see the risk of debris flow for a fire prior to 2020:
A. Click the basemap button and look under the “Overlays” heading
B. Click “Turn off all overlays”
4/_
C. Pan the map to the approximate area.
D. Click the basemap button, look under the “Overlays” heading and turn on layers in the following order:
ESRI roads and labels
State boundary
(year) Basin combined hazard
All streams rivers lakes
Segment combined hazard
Fire name (does not work for 2017 fires)

E. Finally click “Menu” ==> “Link to this map”
The link that is displayed will replicate the map on your screen.
I recommend you run that long link through a link shortener. I use bitly.com
Oppsie - I just checked this #GIS server, Turns out that it no longer has data for the 2017 wildland fires. I will delete the 2017 layers from the list of layers that the map can display.
Typo in the first post in this thread.
The hashtag should be #DebrisFlow
Map now shows areas of possible #DebrisFlow from the #CZULightningComplex fire. That data layer is provided by #SantaCruzCounty. For more information about the map, please see the earlier posts in this thread.

Open #GISsurfer map: bit.ly/3plEbvs Image
If you live near the #CZULightningComplex fire then you should keep an eye on the official #SantaCruzCounty evacuation map.
community.zonehaven.com Image
The map now shows two more #GIS layers from #SantaCruzCounty. These show the county streets and building footprints. The map is centered along Boulder Creek when it opens. Click “Map tips” for help. #DebrisFlow

Open #GISsurfer map: bit.ly/3sW8JWH Image
Blue dots are weather stations with tipping buckets. Risk of #DebrisFlow is based on about 1/4" of rain in 15 minutes. Map can also now show FEMA 100 year flood plain. Need help? Please read the “Map tips”.

Open #GISsurfer map: bit.ly/2MnQwRc Image
Each time you open this map you will see the latest weather watches and warnings. Zoom in, click your area and then follow the link for official details from NOAA. (Currently that server is real slow.) #DebrisFlow

Open #GISsurfer map: bit.ly/36h02fT Image

• • •

Missing some Tweet in this thread? You can try to force a refresh
 

Keep Current with Joseph Elfelt

Joseph Elfelt Profile picture

Stay in touch and get notified when new unrolls are available from this author!

Read all threads

This Thread may be Removed Anytime!

PDF

Twitter may remove this content at anytime! Save it as PDF for later use!

Try unrolling a thread yourself!

how to unroll video
  1. Follow @ThreadReaderApp to mention us!

  2. From a Twitter thread mention us with a keyword "unroll"
@threadreaderapp unroll

Practice here first or read more on our help page!

More from @MappingSupport

26 Jan
1/_ Calling 911 with a cell phone to get help? They might not know your location unless you tell them! FindMeSAR.com (I am developer) is a web page that uses the GPS in your phone to display your coordinates and accuracy value. #SearchAndRescue #DebrisFlow Image
2/_ Use it like so:
Browse to FindMeSAR.com
Tap “Next format” until the yellow screen appears
Wait a few seconds for the accuracy value to get to 30 feet or less
Tap ‘Stop”
#EmergencyManagement
3/_ The yellow screen displays your location in latitude longitude, decimal degrees. Every 911 call center understands that coordinate format.
There is an icon you can save on your home screen.
Read 9 tweets
15 Jan
1/_ Trump does not own Mar-a-Lago and is prohibited from living there by the 1993 agreement he signed and permits issued by the City of Palm Beach. See thread for links to source documents.
**I will post unroll link.** Image
2/_ In early 1993 Trump was the sole owner of Mar-a-Lago. He filed an application with the city to convert it into a private club since he was in financial trouble and the cost of upkeep was high.
3/_ Chronology
March 1993 - Application for a Special Exemption Use and Preservation Plan
April 1993 - Addendum to the application
November 1993 - Use Agreement
Read 22 tweets
16 Dec 20
1/18 Yesterday @gregolear published an article by @ThatShockratees which has the potential to be a game-changer for the senate by preventing Mitch McConnell from stonewalling the Biden agenda.

This thread provides additional analysis, clarification and citation to authority.
2/18 I have gone full circle from endorsing the idea, to expressing great skepticism and, after additional research, am back on the endorsing side. My compliments to @ThatShockratees

The analysis below *assumes* Rs retain the senate majority.
3/18 The published article talks about two things.

1. Delegation of the task of presiding over the senate.
2. Decisions by presiding officer as to which senator is recognized to speak.

The key is #2.
Read 22 tweets
18 Oct 20
1/7 This tweet thread describes the authoritative USA county-level *daily count* COVID-19 data that is hosted on my server and which can be used by anyone for any non-commercial purpose. #COVID19 #COVID #CovidData Image
2/7 #JohnsHopkinsUniversity is widely regarded as one of the primary sources for authoritative COVID-19 data. Hopkins curates this data from various sources and hosts it on GitHub at
github.com/CSSEGISandData…
3/7 The #JohnsHopkins “timeseries” data is a *cumulative count* of cases and deaths. My code automatically runs each night and converts those cumulative counts into *daily counts*. I am hosting this daily count data in separate csv files per month.
Read 8 tweets
17 Oct 20
1/14 I have been volunteering to produce online wildland fire maps for about the last 10 years. This is a multi-part tweet to help people understand satellite hotspot data for wildland fires.
2/14 The #1 thing to know is that any fire data you see on maps is **not real time**. After a satellite pass it takes NASA ~3 hours to process the raw data before it can be displayed on any map.
3/14 Since data you see via an online map is **not real time**, never rely on any map (or anything else) to ignore an order to evacuate. The professionals that make decisions which areas must evacuate have more information than is available to you.
Read 15 tweets
28 Sep 20
1/6 I’ve been volunteering to produce online wildland fire maps for about the last 10 years. The #1 thing to know is that any fire data you see on maps is **not real time**. There are 2 MODIS satellites and 2 VIIRS satellites. #GlassFire #GlassIncident #ZoggFire
2/6 The MODIS/VIIRS satellites make a total of 8 passes per 24 hours. For the West Coast very rough timing is midnight to 3am (4 passes) and noon to 3pm (4 passes). It takes NASA ~3 hours to process the raw data before it can be displayed on any map.
3/6 Usually by 7am pacific time the maps are showing all the MODIS/VIIRS data that is available until sometime after 3pm. Hotspot locations are approximate and sometimes the data is ‘false positive’.
Read 6 tweets

Did Thread Reader help you today?

Support us! We are indie developers!


This site is made by just two indie developers on a laptop doing marketing, support and development! Read more about the story.

Become a Premium Member ($3/month or $30/year) and get exclusive features!

Become Premium

Too expensive? Make a small donation by buying us coffee ($5) or help with server cost ($10)

Donate via Paypal Become our Patreon

Thank you for your support!

Follow Us on Twitter!