
My new content is on Mastodon at
https://t.co/lU28X2nWBy
Software project page https://t.co/x7r8jsQOSH
 2/_ Use it like so:
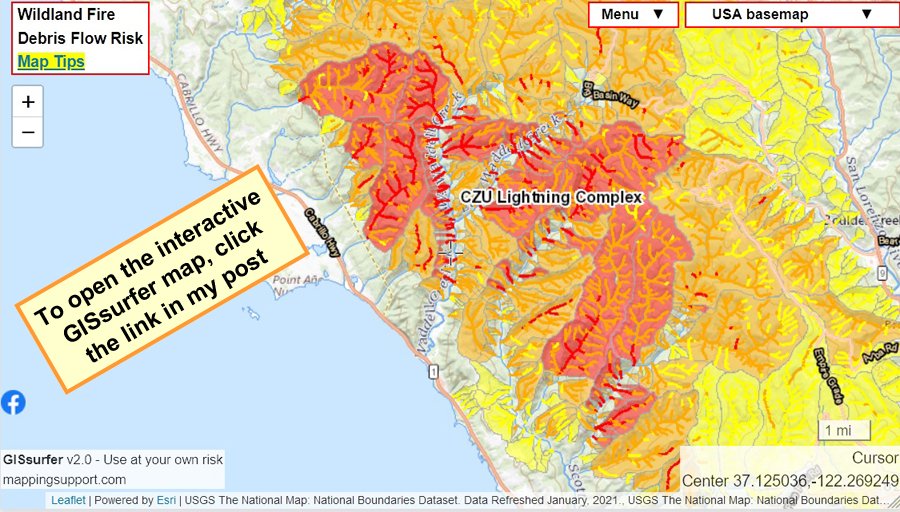 2/_ The map opens at the #CZULightningComplex. You can pan the map to other 2020 fires and see the same type of data. Be patient! The map might be slow to refresh. It depends in part on how much other work the GIS server is doing.
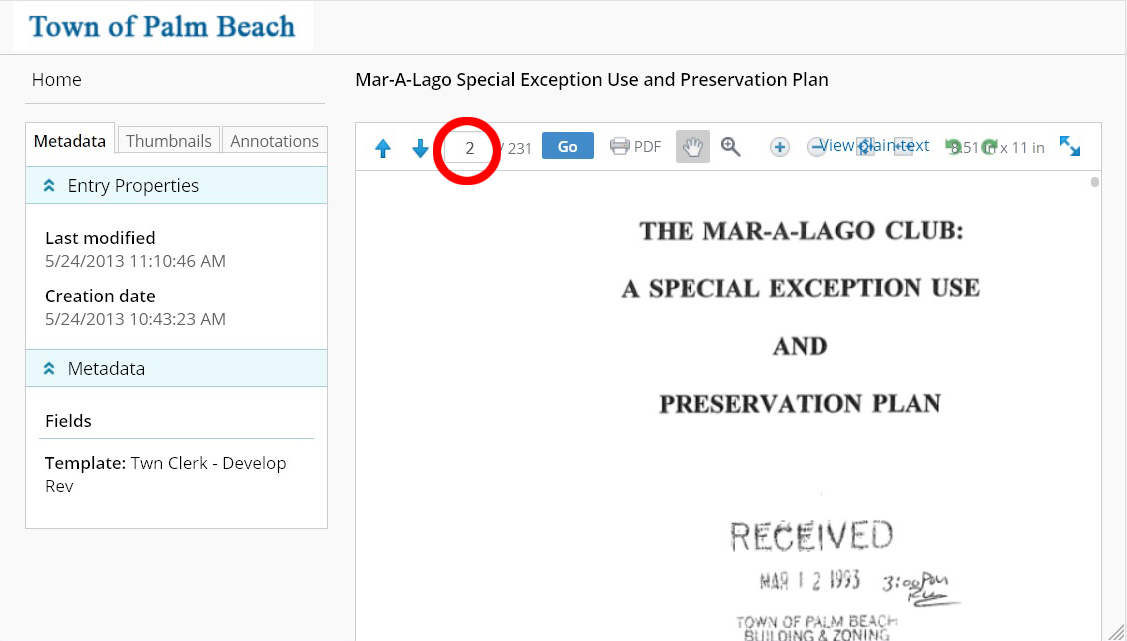 2/_ In early 1993 Trump was the sole owner of Mar-a-Lago. He filed an application with the city to convert it into a private club since he was in financial trouble and the cost of upkeep was high.

 2/7 #JohnsHopkinsUniversity is widely regarded as one of the primary sources for authoritative COVID-19 data. Hopkins curates this data from various sources and hosts it on GitHub at
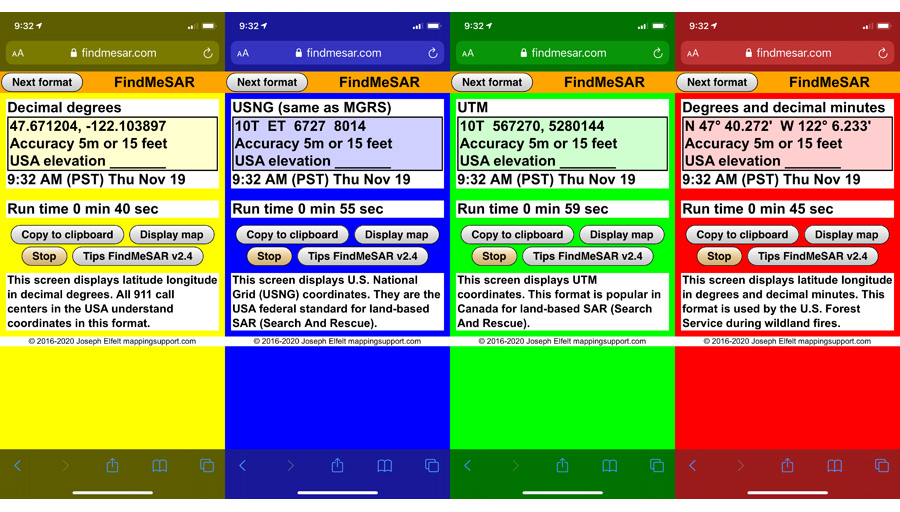
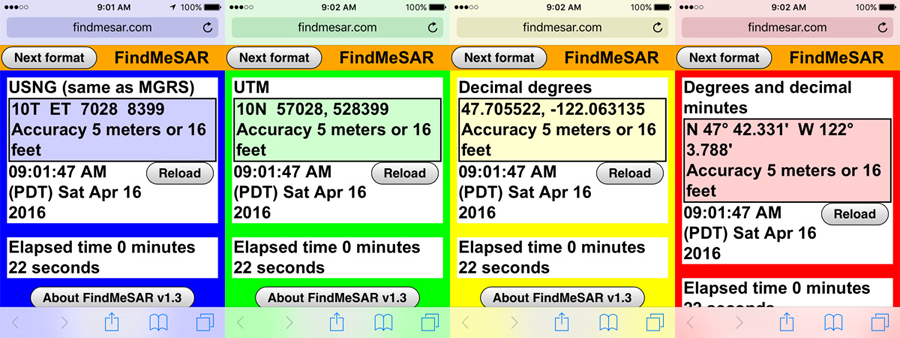 2/9 #FindMeSAR (findmesar.com) is a webpage that uses the GPS in your phone to display your coordinates and accuracy value. Several coordinate formats are supported and each one has a different colored screen.
 2/4 Caution! Satellite hotspot data is *always* several hours old when you see it on a map and locations are approximate. Never rely on any map to ignore an order to evacuate!
 2/6 Several coordinate formats are supported and each has a different colored screen. The yellow screen displays your location in latitude longitude, decimal degrees. This format is used by all 911 call centers.
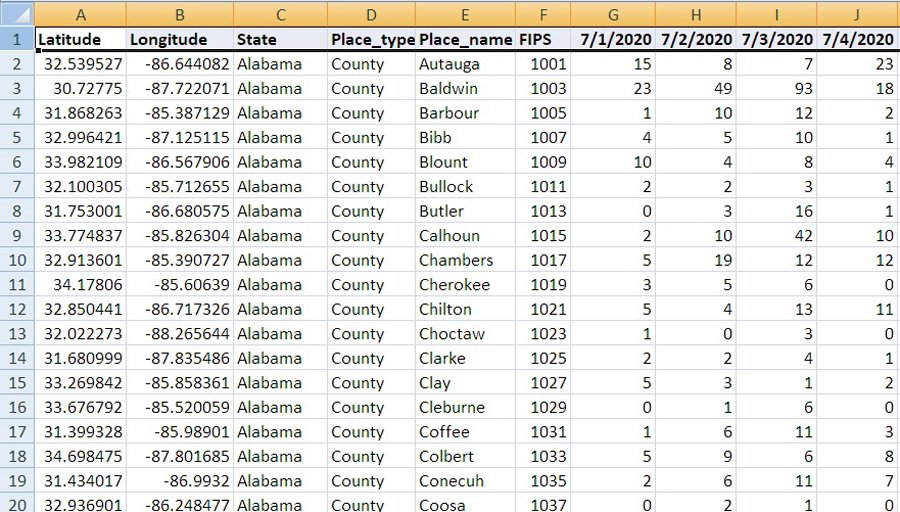 2/7 This daily count data is in one csv file per month. There is one set of files with daily *case* counts and another set of files with daily *death* counts. Anyone can download and use this data. The only limitation is no commercial use.
 2/5 Each day #JohnsHopkins publishes updated timeseries *cumulative* counts of new cases and deaths for all USA counties. As a public service I wrote code to convert that cumulative count data into *daily* counts. Non-commercial use only.
 2/4 The daily count data is in one csv file per month. These files include a latitude longitude centroid for each county and will be easy to import into spreadsheet or #GIS software. Each night the count of new cases for the prior day is added to the current csv file.
 2/2 The daily counts of new COVID19 cases are in one csv file per month starting March (data starts on the 24th). Below is an example download link.
 2/4 Each location on the map has two symbols. Circle = prior 14 days. Triangle = prior 7 days. Red = count is trending up. Green = count is trending down.
 2/4 Government agencies host all kinds of GIS data. Anyone can use GISsurfer to look at that data almost as easy as you surf the internet. No GIS savvy required! You can add GIS data to the map and then save a link that will display your map.
 2/7 @server Admins: If my list says “not https” or “SSL problem” then you can fix that with a free SSL certificate from letsencrypt.org. My domains use these. The “SSL problem” tag in the curated server list means Firefox found something wrong with your SSL certificate.