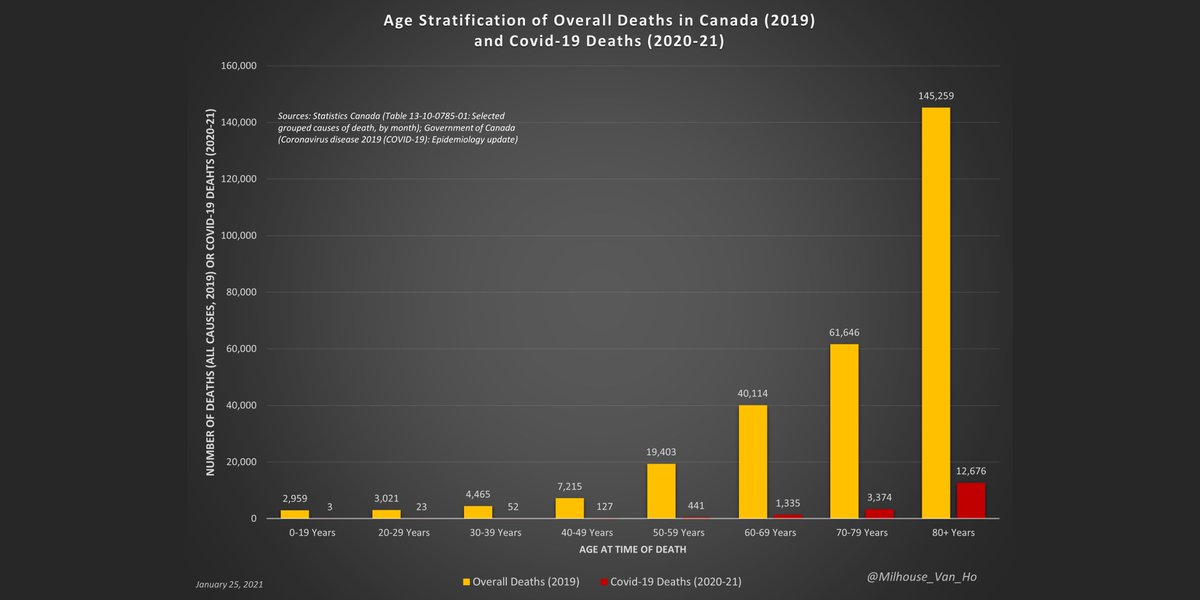
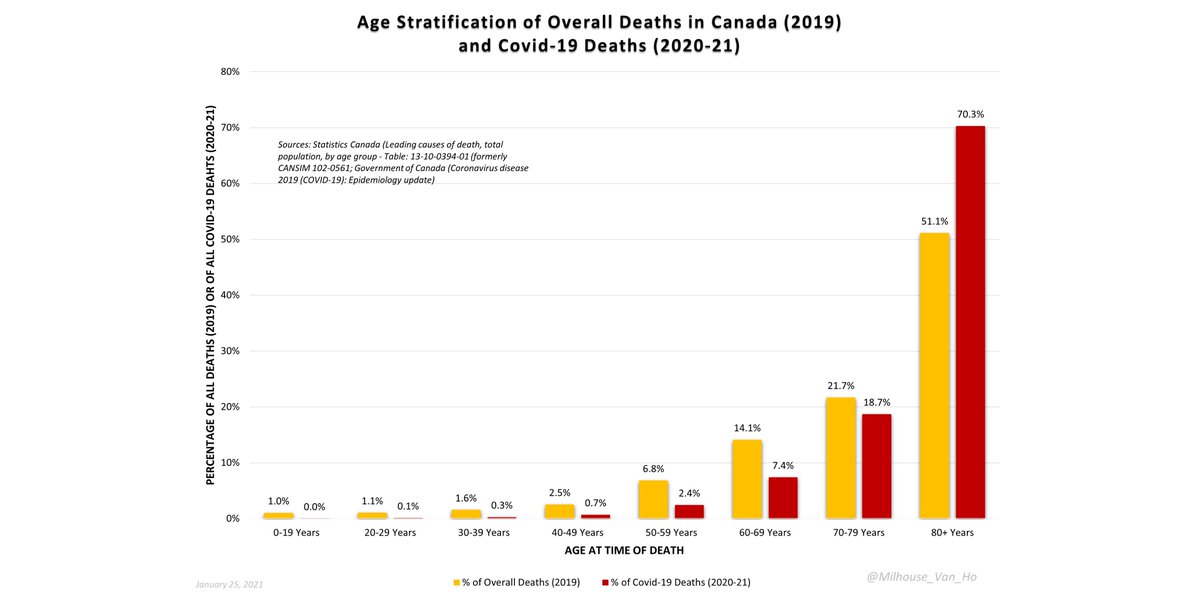
The number of deaths from all causes in 2019 vs. number of deaths from or with Covid-19 in 2020-21. 

The average age of a death by or with covid-19 is higher than life expectancy.
Deaths among those over 80 account for 70.3% of deaths by/with covid-19, but only 51.1% of all deaths (all causes) in 2019.
Deaths among those over 80 account for 70.3% of deaths by/with covid-19, but only 51.1% of all deaths (all causes) in 2019.
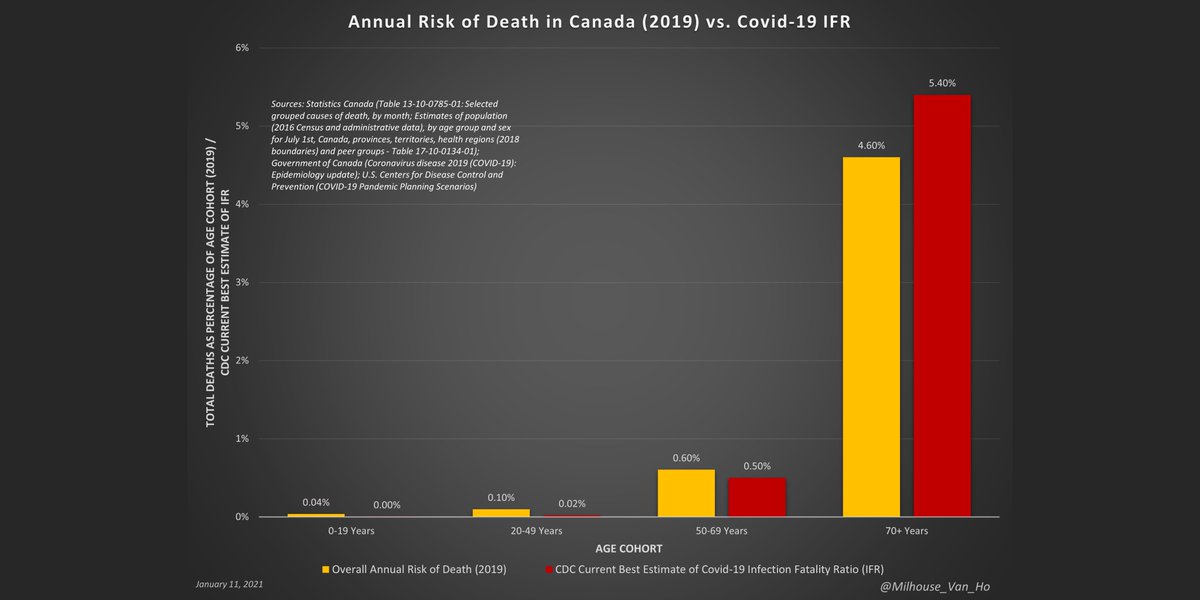
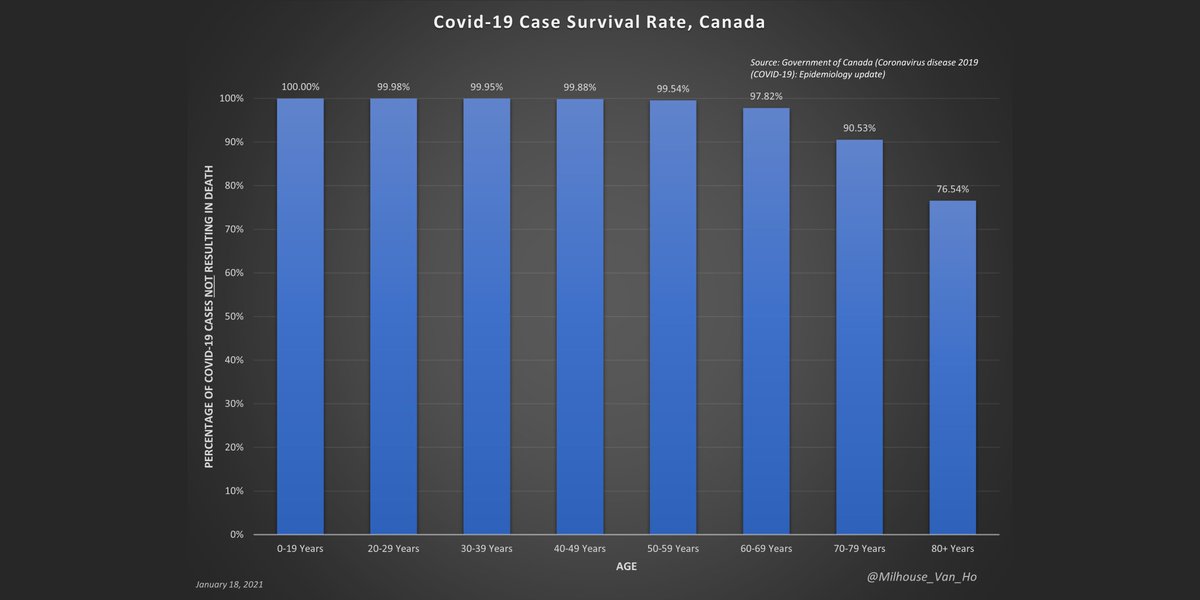
If you are under 70, your risk of dying after being infected with SARS-CoV-2 is lower than your annual risk of death.
If you are over 70, your risk of dying after being infected is slightly higher than your annual risk of death.
If you are over 70, your risk of dying after being infected is slightly higher than your annual risk of death.

Canada – Case survival rates (= 100% - case fatality rate) by age.
(True survival rates based on IFR should be significantly higher.)
(True survival rates based on IFR should be significantly higher.)

The 80+ age cohort accounts for 51% of all-cause deaths in Canada and 70% of deaths from or with Covid-19, but only 4% of the population.
In contrast, children account for 22% of the pop. but only 1% of all-cause deaths in Canada and 0% (0.02%) of deaths from or with Covid-19.
In contrast, children account for 22% of the pop. but only 1% of all-cause deaths in Canada and 0% (0.02%) of deaths from or with Covid-19.

Among > 80 in Canada, there were 8,939 deaths of all causes in 2019 and 780 deaths from or with Covid-19 per 100,000 people in 2020-21.
In contrast, among children, there are 36 deaths of all causes in 2019 and 0 (0.04) deaths from or with Covid-19 per 100,000 people in 2020-21.
In contrast, among children, there are 36 deaths of all causes in 2019 and 0 (0.04) deaths from or with Covid-19 per 100,000 people in 2020-21.

Here we have the total number of deaths in Canada over the past five years. The most recent 12 months of data do not suggest a spike in deaths out of line with historical trends.

Zooming out nationally over the past decade, we see that it's perfectly natural for deaths in one year to exceed deaths in the previous year.
***This does not necessarily = excess deaths.***
Look how often the blue growth line is above 0%.
***This does not necessarily = excess deaths.***
Look how often the blue growth line is above 0%.

So deaths are rising.
Is that due to population growth?
Population aging?
It's a bit of both, but not covid.
Is that due to population growth?
Population aging?
It's a bit of both, but not covid.
Here we have the chart you saw earlier now expressed as a rate per 100,000 people. Generally, a flatter trend in death rates would suggest that population growth may be a key factor driving growth in total deaths.

Across the decade, again we see that when we adjust for population growth, the growth trend is weaker but still there - the aging of the population is likely the primary factor.
Deaths are rising in absolute and relative terms, suggesting a combo of population growth and aging.
Deaths are rising in absolute and relative terms, suggesting a combo of population growth and aging.

Canada total weekly deaths Jan. 2010-Aug. 2020.

Here is a simple chart of deaths and death rates since 1900, using data collated by Wikipedia (to 2019) and collected by Statistics Canada (2020).

Too early to draw conclusions on what this means but here are leading causes of death in Canada over the past 5 years.
Many recent deaths remain unclassified in the "information unavailable" column and will presumably will properly attributed over time.
Many recent deaths remain unclassified in the "information unavailable" column and will presumably will properly attributed over time.

Here is the same, presented as rates per 100,000 population to account for population growth.
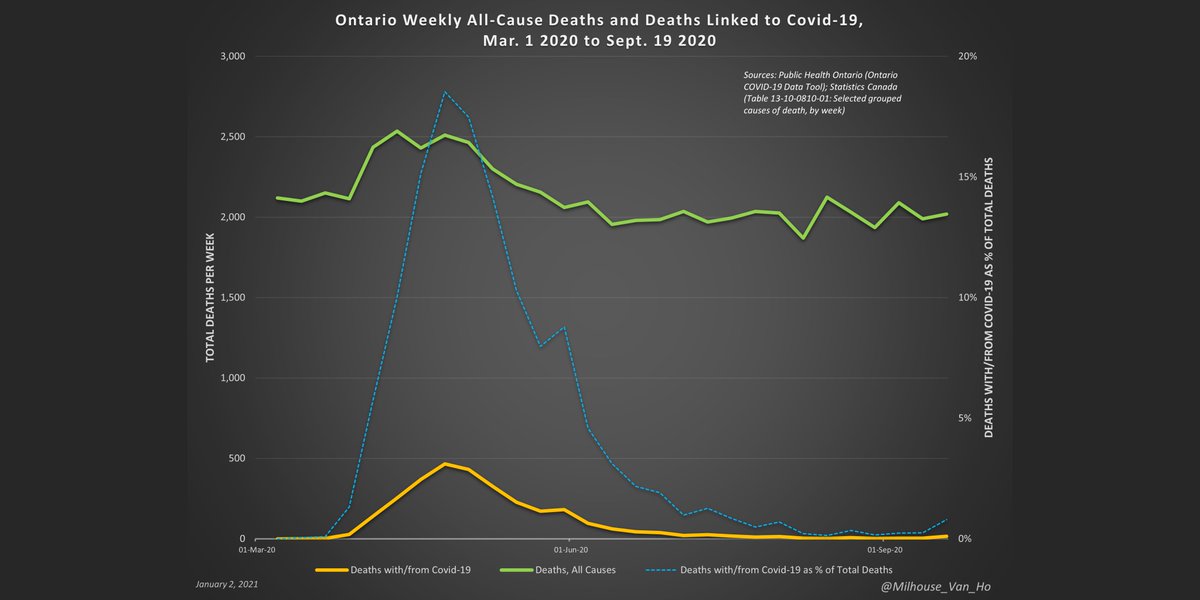
A key question to address as this data evolves is the degree to which deaths attributed to covid-19 have substituted for deaths attributed to other causes.
A key question to address as this data evolves is the degree to which deaths attributed to covid-19 have substituted for deaths attributed to other causes.

Note that Covid-19 is often not a wholly distinct and separate cause of death as there are other medical conditions involved in many cases.
There are also cases in which it is not even a cause of death, but the individual had tested positive sometime prior to their death.
There are also cases in which it is not even a cause of death, but the individual had tested positive sometime prior to their death.

www150.statcan.gc.ca/t1/tbl1/en/cv.…
www150.statcan.gc.ca/t1/tbl1/en/tv.…
health-infobase.canada.ca/covid-19/epide…
en.wikipedia.org/wiki/Demograph…
www150.statcan.gc.ca/t1/tbl1/en/tv.…
health-infobase.canada.ca/covid-19/epide…
en.wikipedia.org/wiki/Demograph…
• • •
Missing some Tweet in this thread? You can try to
force a refresh