The largest wealth transfer in history.
Time for a thread 👇👇👇
Time for a thread 👇👇👇
Today’s mix of monetary and fiscal policies are having a very different economic impact then we saw post the GFC.
Back then, deflationary forces were exacerbated by a brutal wealth loss problem.
Especially the lower classes.
They lost over 84% of their net worth from '07-'11.
Back then, deflationary forces were exacerbated by a brutal wealth loss problem.
Especially the lower classes.
They lost over 84% of their net worth from '07-'11.

This time we are seeing the complete opposite.
Lower classes just increased their wealth at the highest annual amount in the history of the data.
Lower classes just increased their wealth at the highest annual amount in the history of the data.

In fact, the bottom 50% net worth not only increased but is now 77% higher than it was at the peak of the housing bubble.

If we zoom out, this is what the prior chart looks like going back to the 90s.

Balance sheets also look stronger.
The liability to asset ratio for the bottom 50% is now at its lowest level in over a decade.
The liability to asset ratio for the bottom 50% is now at its lowest level in over a decade.

Another important point:
The bottom 50% net worth has improved relative to almost all other parts of the society for the last 10 years.
The bottom 50% net worth has improved relative to almost all other parts of the society for the last 10 years.
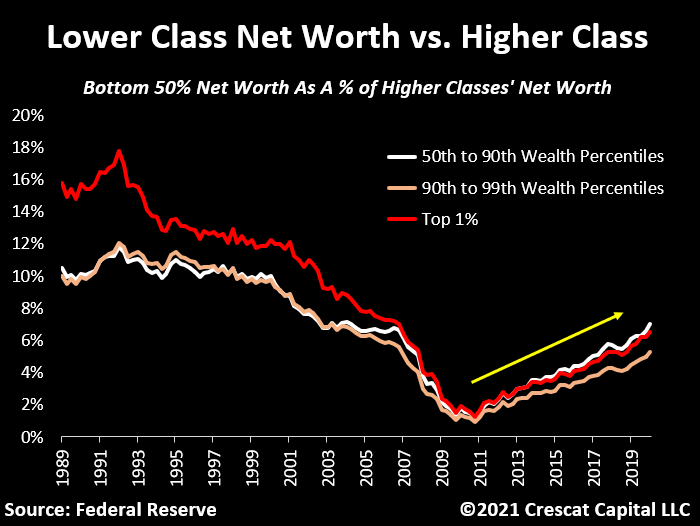
But the top 1% still holds over 15x more financial assets than the bottom 50%!
They are the ones who have truly benefitted from easy money policies to date.
They are the ones who have truly benefitted from easy money policies to date.

The bigger point is that the recent improvements in the bottom 50% net worth certainly have nothing to do with vibrant macro conditions.
Again, it is quite the opposite.
Again, it is quite the opposite.
Corporate earnings are depressed.
Economic activity remains well below its historical average with 18.4 million people claiming unemployment insurance benefits.
Nonetheless, what we have seen is a major wealth transfer from the government to the people.
Economic activity remains well below its historical average with 18.4 million people claiming unemployment insurance benefits.
Nonetheless, what we have seen is a major wealth transfer from the government to the people.
Just from January to July of 2020:
The bottom 50% increased their net worth by $403B.
The 50th to 90th wealth percentiles by $2.4T.
The 90th to 99th by $4.1T.
And the top 1% by $4.7T.
In aggregate, the US total population wealth increased by $11.8 trillion in 6 months!
The bottom 50% increased their net worth by $403B.
The 50th to 90th wealth percentiles by $2.4T.
The 90th to 99th by $4.1T.
And the top 1% by $4.7T.
In aggregate, the US total population wealth increased by $11.8 trillion in 6 months!
To be clear, the government needs this ‘money party’ to go on.
In fact, it can’t afford to let it stop.
The cost of living will probably keep going up.
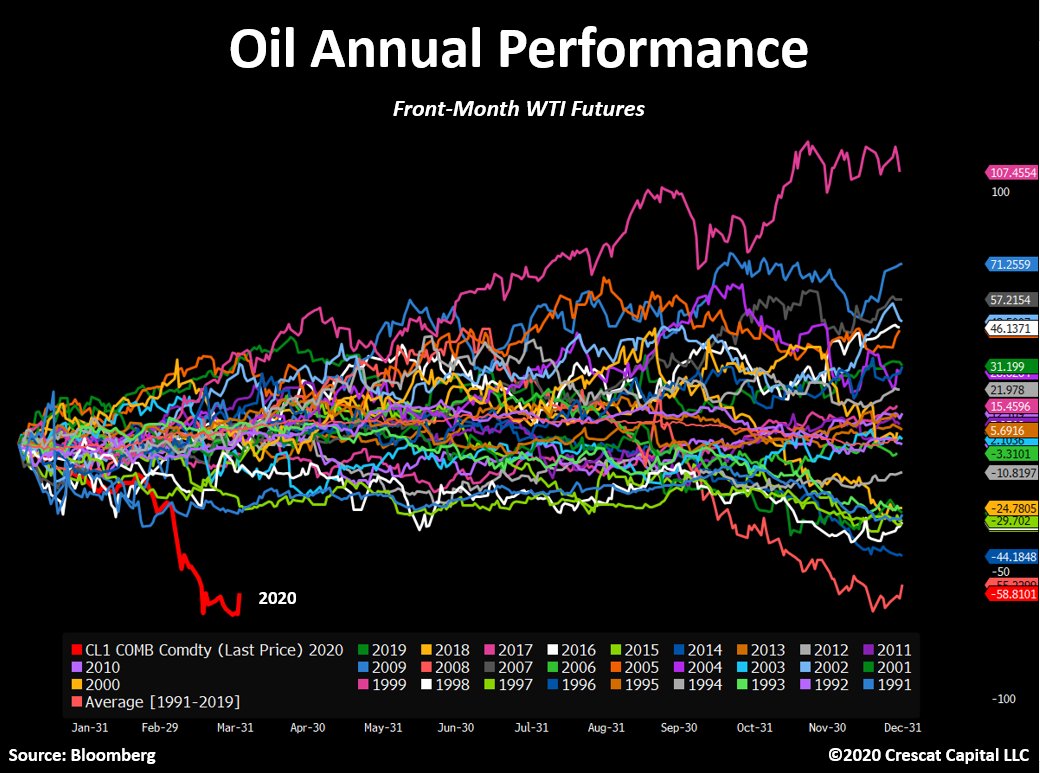
Meanwhile, the global economy remains on the verge of a major commodity supply shortage.
In fact, it can’t afford to let it stop.
The cost of living will probably keep going up.
Meanwhile, the global economy remains on the verge of a major commodity supply shortage.
What perplexes us is how anyone can still say that the resolution of all this will be massively deflationary?
Thinking today’s monetary and fiscal policies will have the same social and economic consequences that we had after the GFC is absurd.
Thinking today’s monetary and fiscal policies will have the same social and economic consequences that we had after the GFC is absurd.
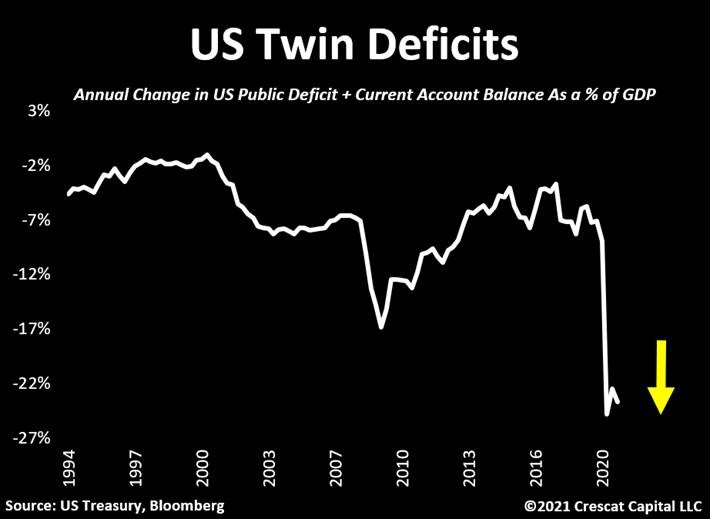
The problem is that someone has to pay for this massive wealth transfer.
Government deficits keep expanding.
The trade balance isn’t helping.
Now at its lowest level since 2006.
At $27 trillion of public debt, I think we are only getting started.
Government deficits keep expanding.
The trade balance isn’t helping.
Now at its lowest level since 2006.
At $27 trillion of public debt, I think we are only getting started.
And who is funding all this?
Let’s do the math:
Public debt increased by $4.5T since 2020.
The Fed and US banks’ ownership of Treasuries increased by $3.1T.
In other words, they funded 70% of it all.
Let’s do the math:
Public debt increased by $4.5T since 2020.
The Fed and US banks’ ownership of Treasuries increased by $3.1T.
In other words, they funded 70% of it all.
There is no doubt that commodities have become more popular as of late.
Same goes for the incredibly crowded dollar short bets out there.
But those are all short-term concerns for a much bigger inflationary thesis building up.
Same goes for the incredibly crowded dollar short bets out there.
But those are all short-term concerns for a much bigger inflationary thesis building up.
We believe that a significant ramp up in consumer spending by the bottom 50%, along with the wealthier classes, will indeed fuel inflationary forces.
When combined with a looming commodity supply shortage problem, the setup resembles the macro environment we had in the 1970s.
When combined with a looming commodity supply shortage problem, the setup resembles the macro environment we had in the 1970s.
This will completely change the macro landscape.
The cost of capital will be increasing and impacting risky assets.
The cost of capital will be increasing and impacting risky assets.
Until then, the Fed has two main jobs:
1) Continue to suppress interest rates
2) Make sure financial markets don’t run into trouble.
1) Continue to suppress interest rates
2) Make sure financial markets don’t run into trouble.
In order to succeed, they have no option but to pretend that there is no inflation in the system.
As Clarida said recently:
“No rate hike until we get 2% inflation for a year”.
That hasn’t happened since 2007.
As Clarida said recently:
“No rate hike until we get 2% inflation for a year”.
That hasn’t happened since 2007.
Here is PCE, the Fed’s favorite inflation gauge.
The red parts were the periods when this index stayed above 2% for over a year.
The last time they decided to raise rates in this scenario, they popped the housing bubble.
The red parts were the periods when this index stayed above 2% for over a year.
The last time they decided to raise rates in this scenario, they popped the housing bubble.

You would think they have learned a lesson.
But their track record isn’t the greatest to rely on.
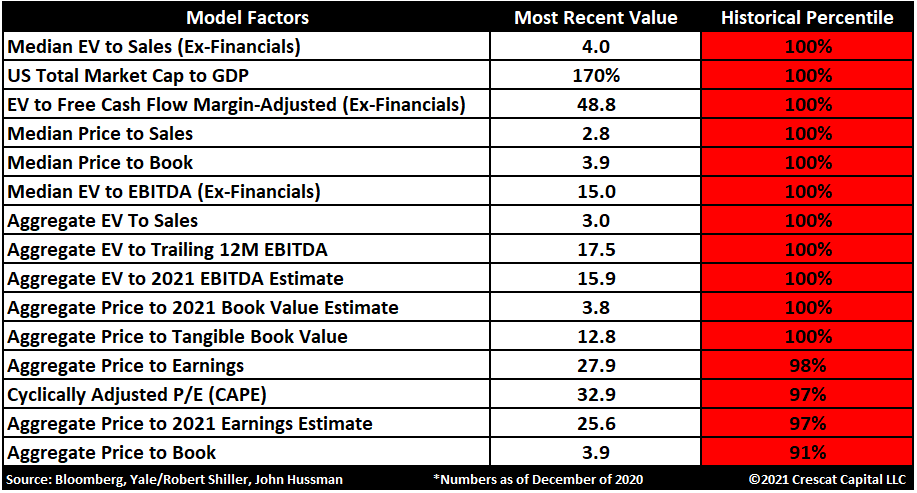
Just keep in mind that in the midst of all this, equities have never been so expensive.
Our 15-factor valuation model shows US stocks at their most overvalued levels since 1900.
But their track record isn’t the greatest to rely on.
Just keep in mind that in the midst of all this, equities have never been so expensive.
Our 15-factor valuation model shows US stocks at their most overvalued levels since 1900.

Here is a list with all 15 valuation metrics.
11 of them at all time highs.
The other 4 are very close.
11 of them at all time highs.
The other 4 are very close.
From a portfolio perspective, the case for buying hard assets and selling hyped/overvalued stocks has never been more compelling.
The more deflationary forces we see, the more monetary debasement will likely result.
The more deflationary forces we see, the more monetary debasement will likely result.
To conclude:
At Crescat, we like commodities.
Especially gold, silver and miners.
We also own some oil, copper and platinum.
To hedge our longs, we also have a large short position in US equity markets and long dollar call options.
crescat.net/crescat-capita…
At Crescat, we like commodities.
Especially gold, silver and miners.
We also own some oil, copper and platinum.
To hedge our longs, we also have a large short position in US equity markets and long dollar call options.
crescat.net/crescat-capita…
• • •
Missing some Tweet in this thread? You can try to
force a refresh