
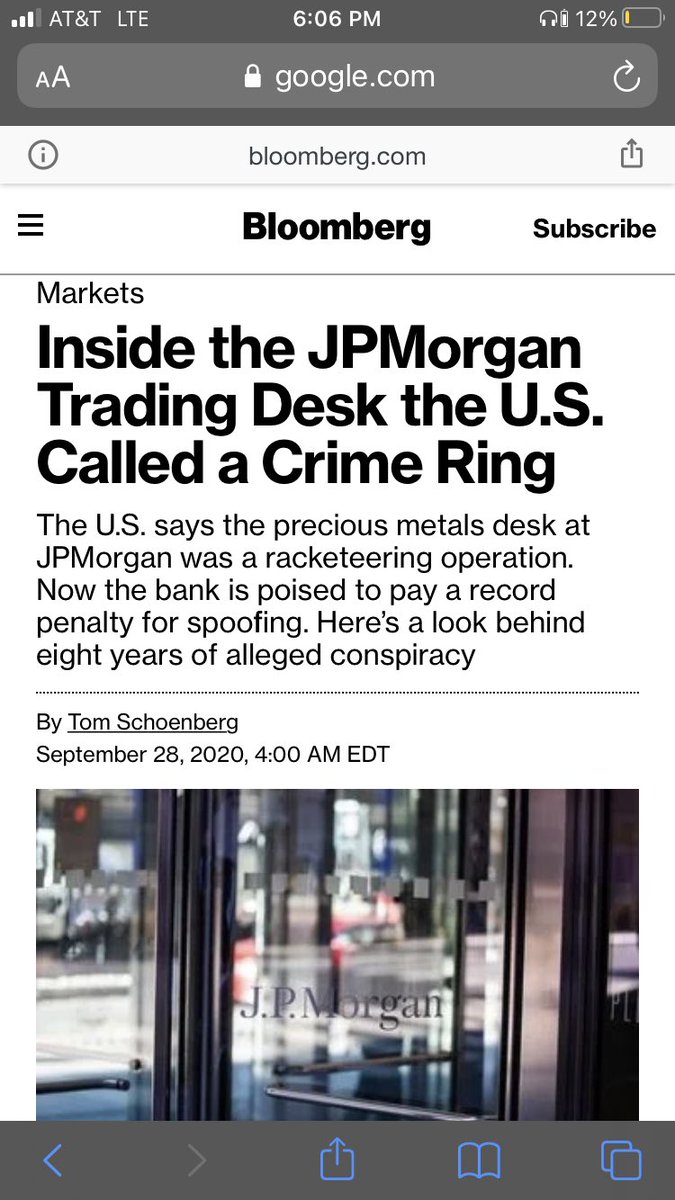
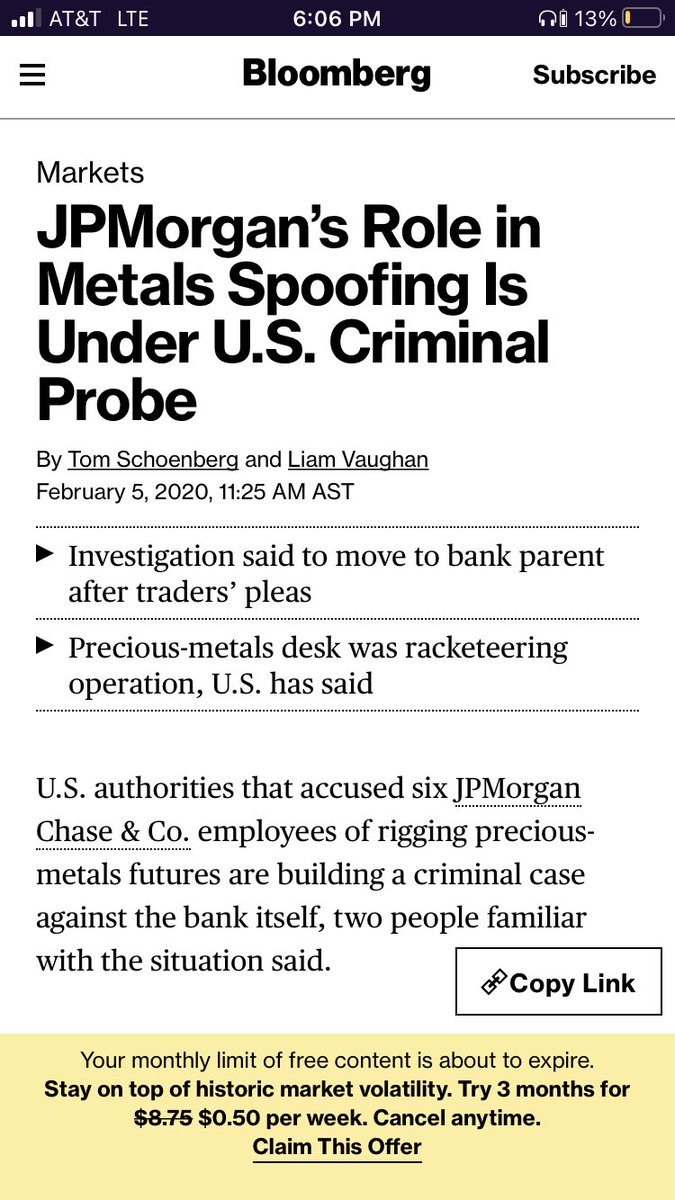
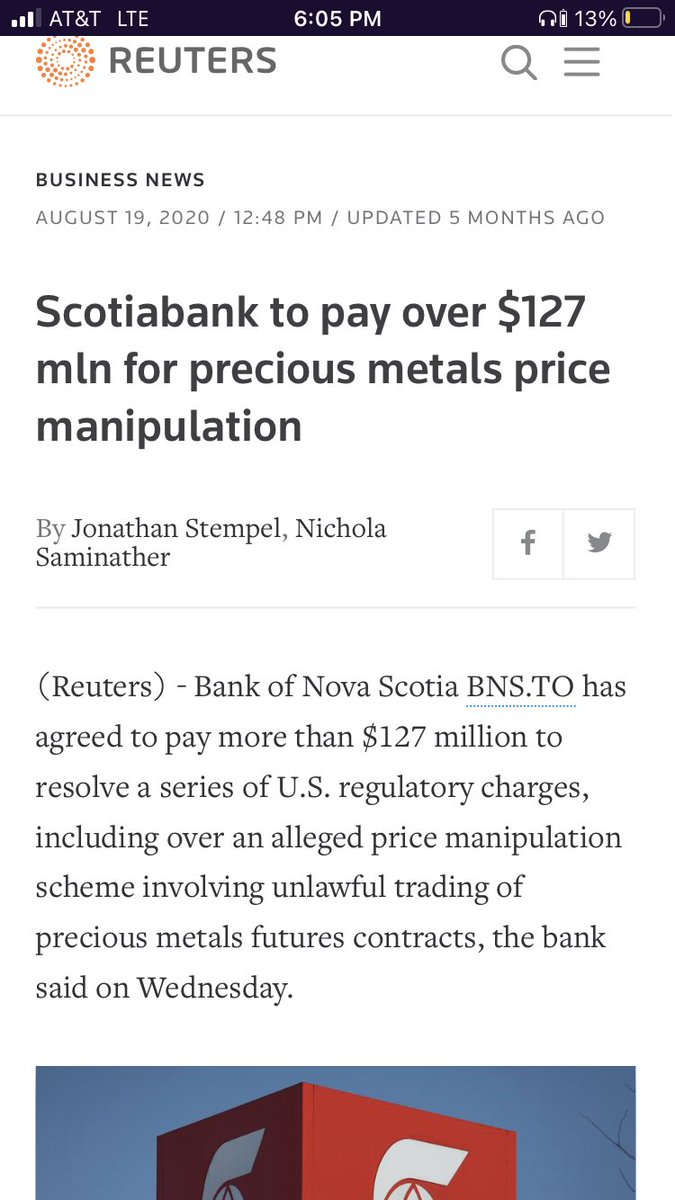
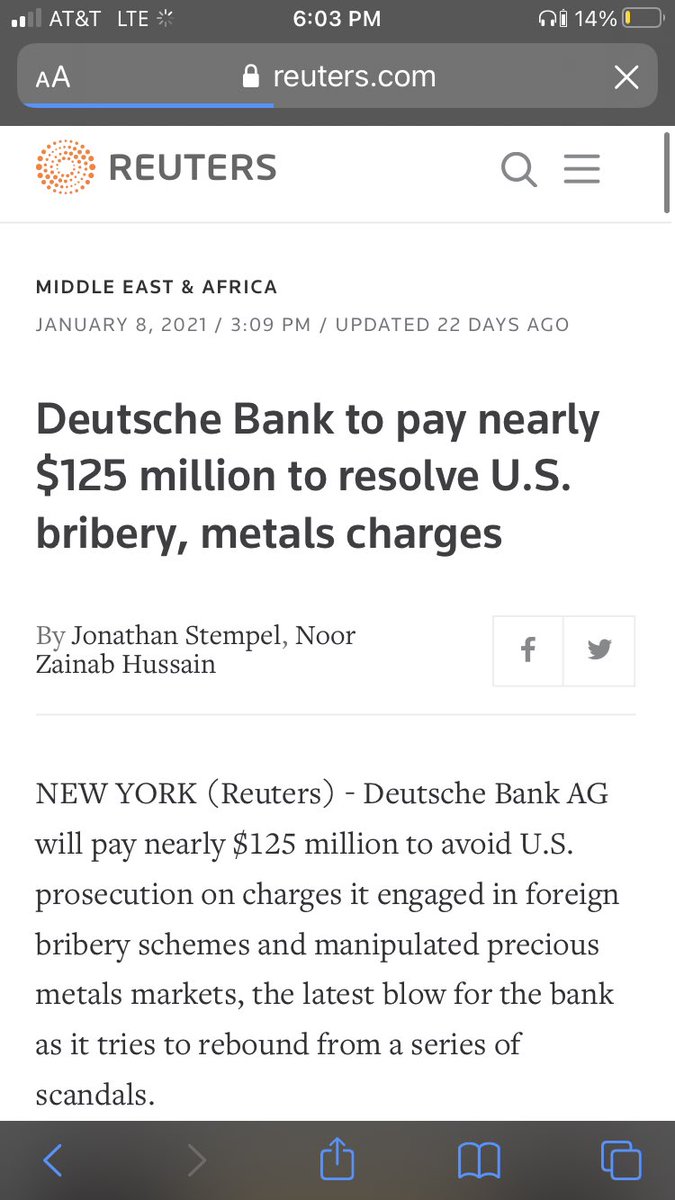
Silver has been manipulated by multiple banks, specifically JP Morgan, custodian of the manipulated $SLV silver derivative market, but they are not the only one responsible for manipulating the silver price
^^ this thread goes in depth on JP Morgan
2/


https://twitter.com/bchainbastards/status/1312908379476631553?s=21
^^ this thread goes in depth on JP Morgan
2/
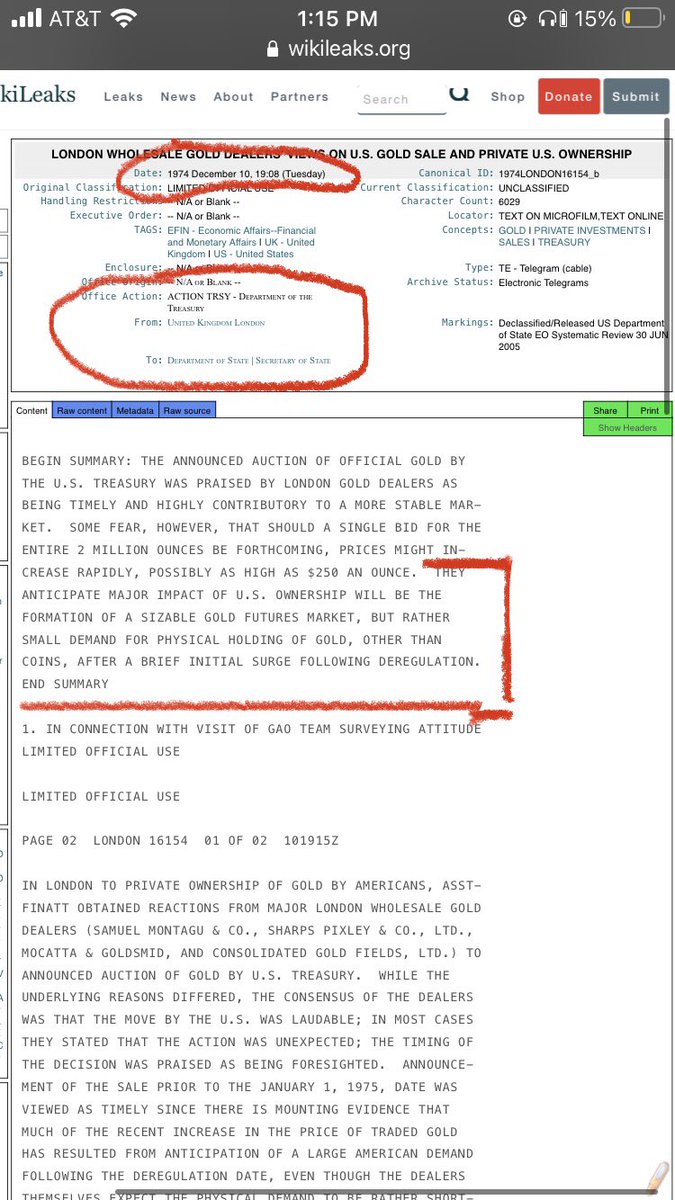
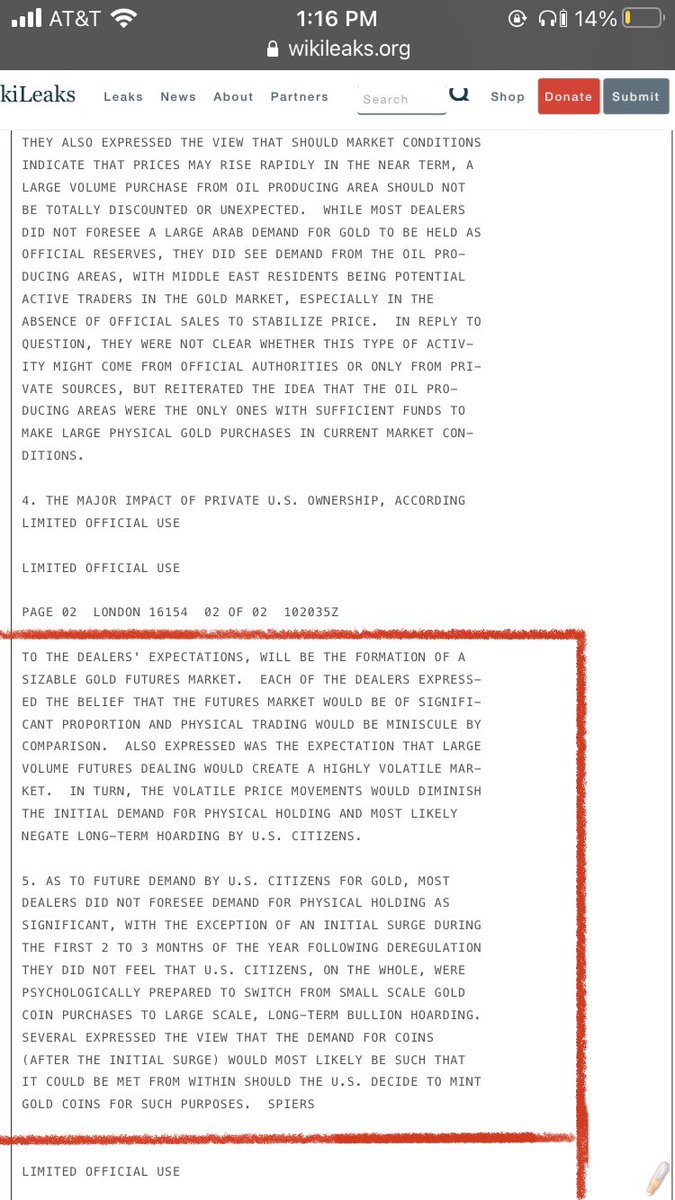
This market manipulation goes back to the years just after America left the gold standard in 1971. The following is from #Wikileaks, originating from the Dept of Treasury.
3/

3/
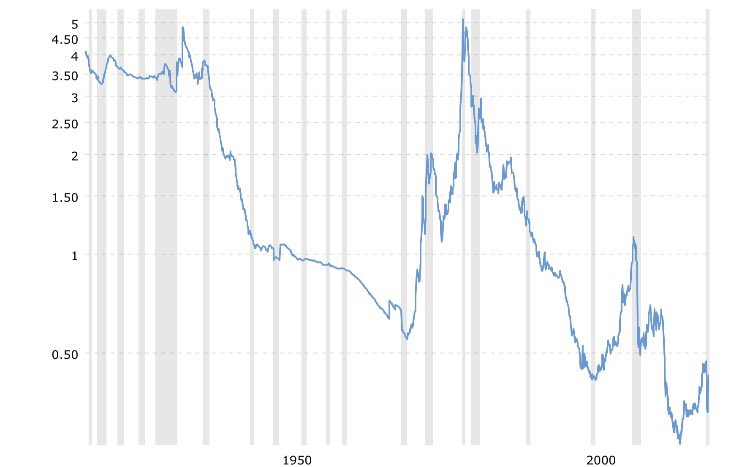
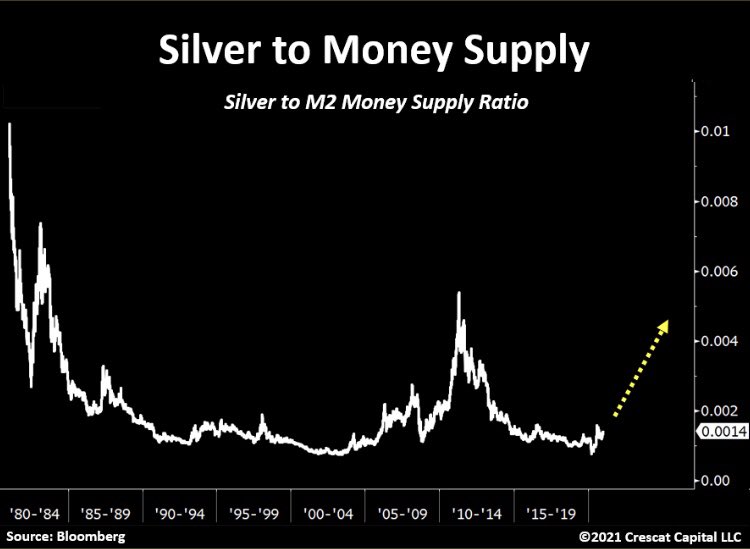
Gold and silver are both heavily manipulated, but it’s silver that comes in first place in the manipulation Olympics.
Check the ratios.
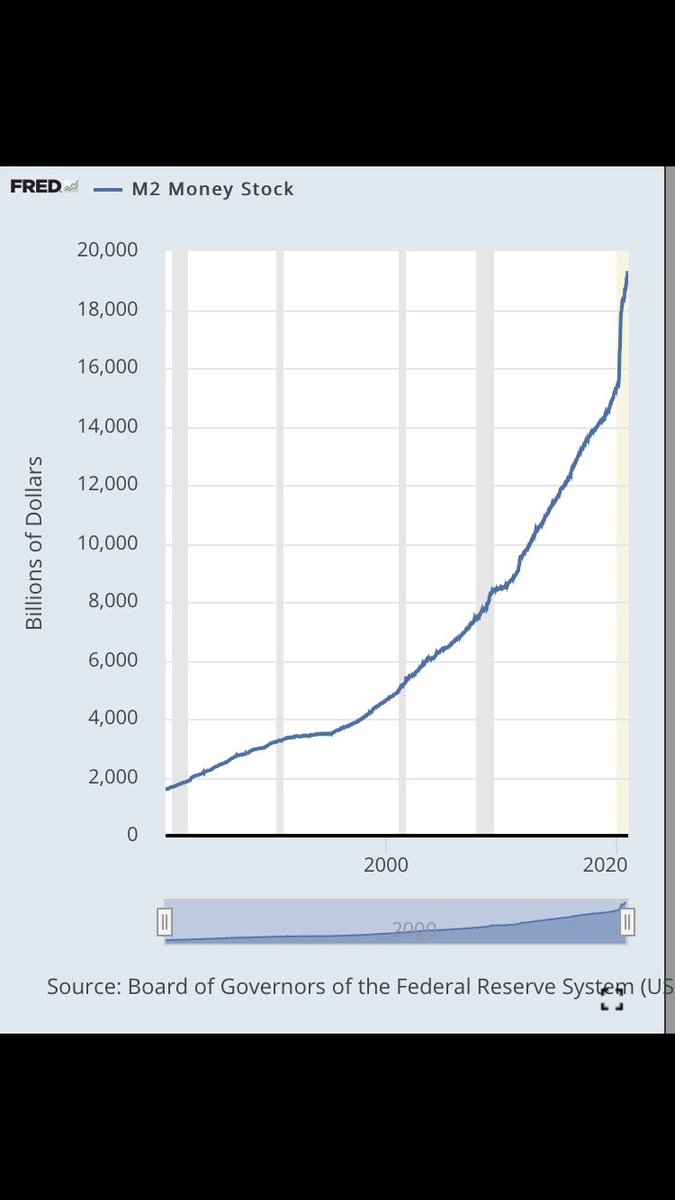
The first chart is the gold to monetary supply ratio
The fourth chart is the Gold to silver ratio (GSR)
Silver at cyclical lows
4/


Check the ratios.
The first chart is the gold to monetary supply ratio
The fourth chart is the Gold to silver ratio (GSR)
Silver at cyclical lows
4/
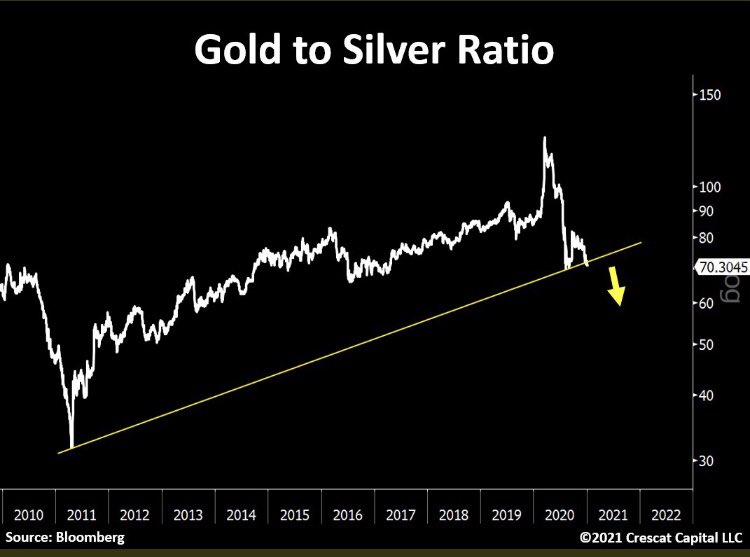
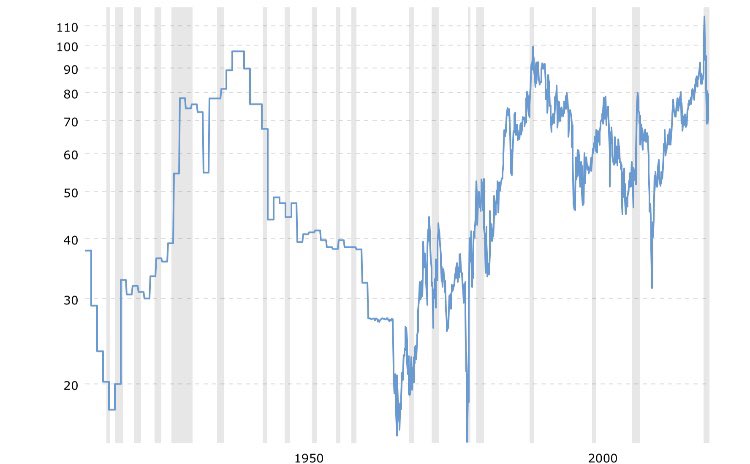
It currently takes 69 oz of silver to buy 1 oz of gold
The naturally occurring gold to silver ratio in the ground is 17.5 oz of silver to 1 oz of gold
Current mining ratio? 8 oz silver for every 1 oz of gold
5/
The naturally occurring gold to silver ratio in the ground is 17.5 oz of silver to 1 oz of gold
Current mining ratio? 8 oz silver for every 1 oz of gold
5/
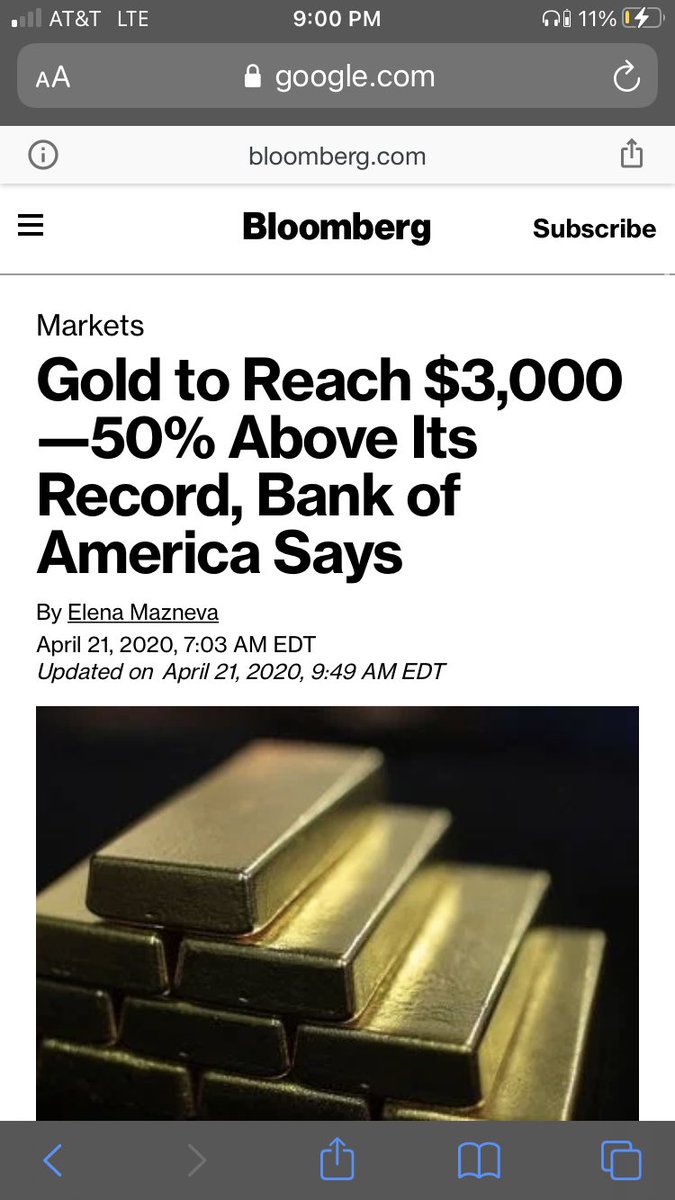
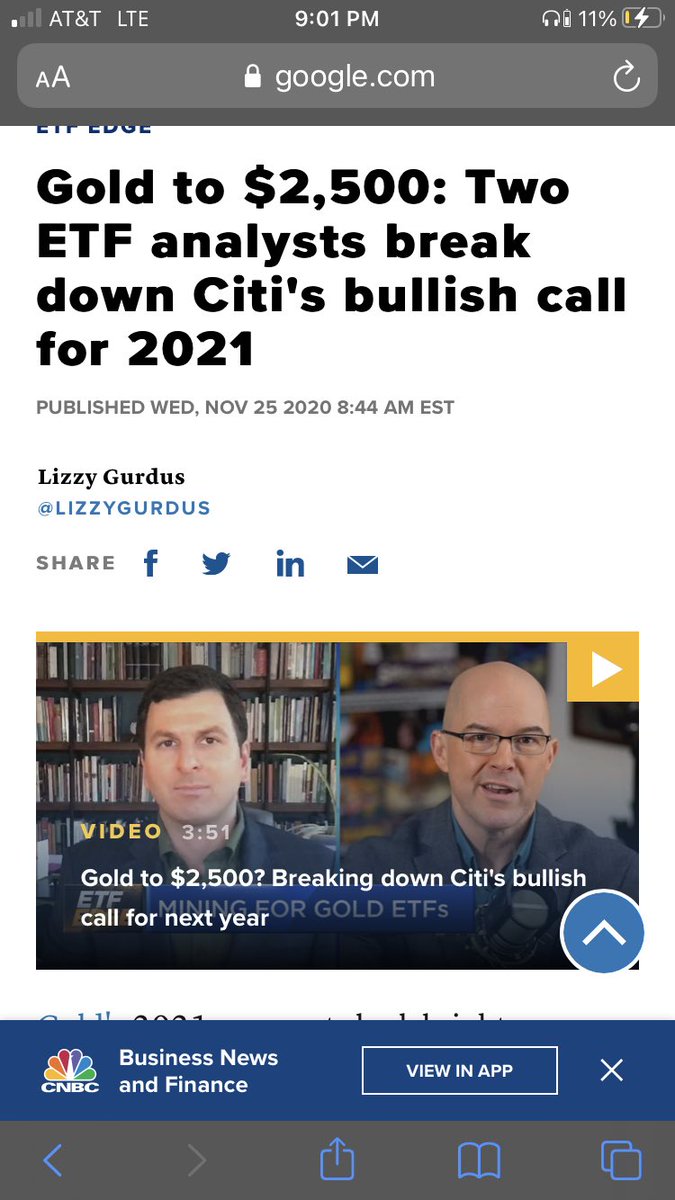
Gold reached its all time high in the summer of 2020 of $2051. Gold is currently at $1850.
Silver only reached 60% of its all time high this summer at a price of $29.
So let’s do a hypothetical of the silver price at key points in the Gold to silver ratio
6/
Silver only reached 60% of its all time high this summer at a price of $29.
So let’s do a hypothetical of the silver price at key points in the Gold to silver ratio
6/
Let’s assume gold to be its summer all time high of $2051, which is a low estimate compared to many’s projections
Gold to silver ratio:
2011 GSR of 31:1? $66 silver
Natural ratio of 17.5:1? $117 silver
1979 GSR of 15:1? $137 silver
Current mining ratio of 8:1? $256 silver
7/


Gold to silver ratio:
2011 GSR of 31:1? $66 silver
Natural ratio of 17.5:1? $117 silver
1979 GSR of 15:1? $137 silver
Current mining ratio of 8:1? $256 silver
7/
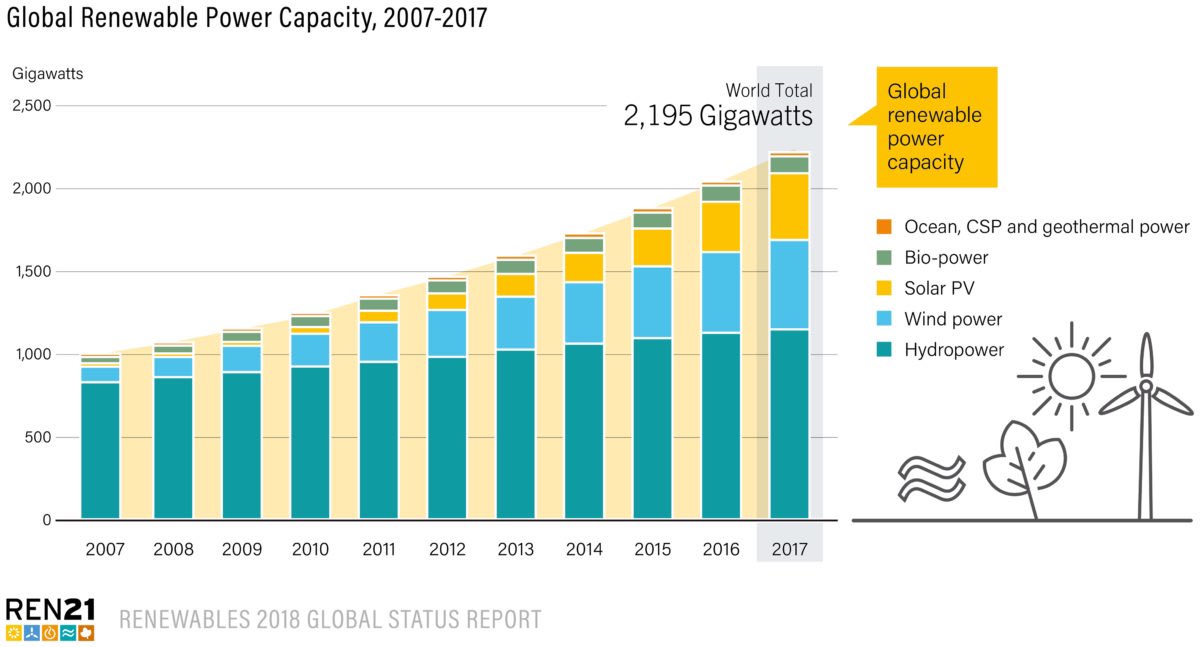
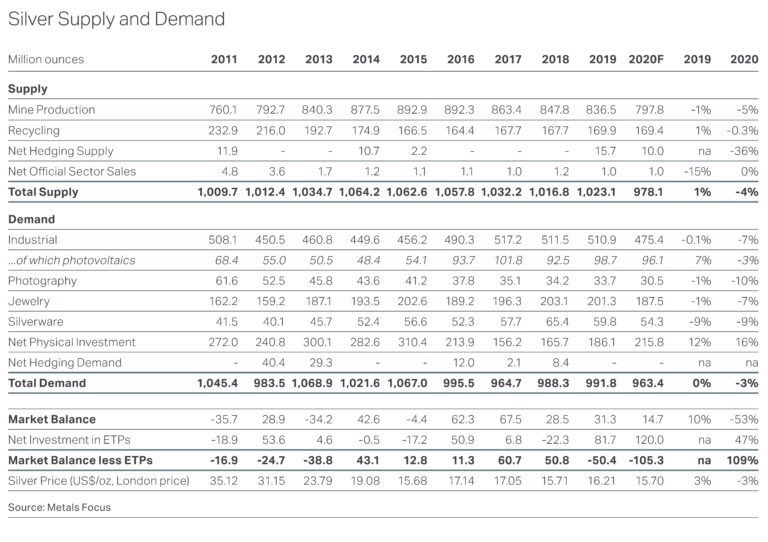
Silver’s fundamentals are very strong
Growing industrial uses, specially green energy use in solar panels, electric vehicles and batteries
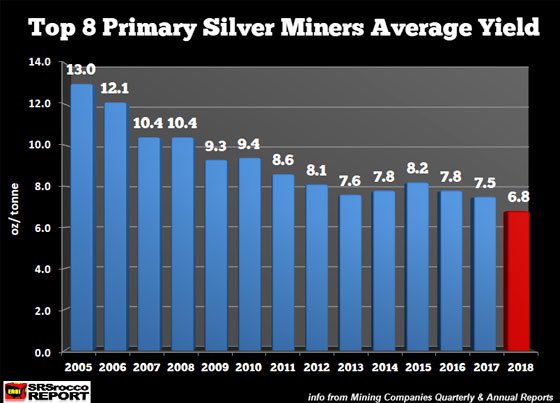
The ore grade of silver mines are continuing to decline
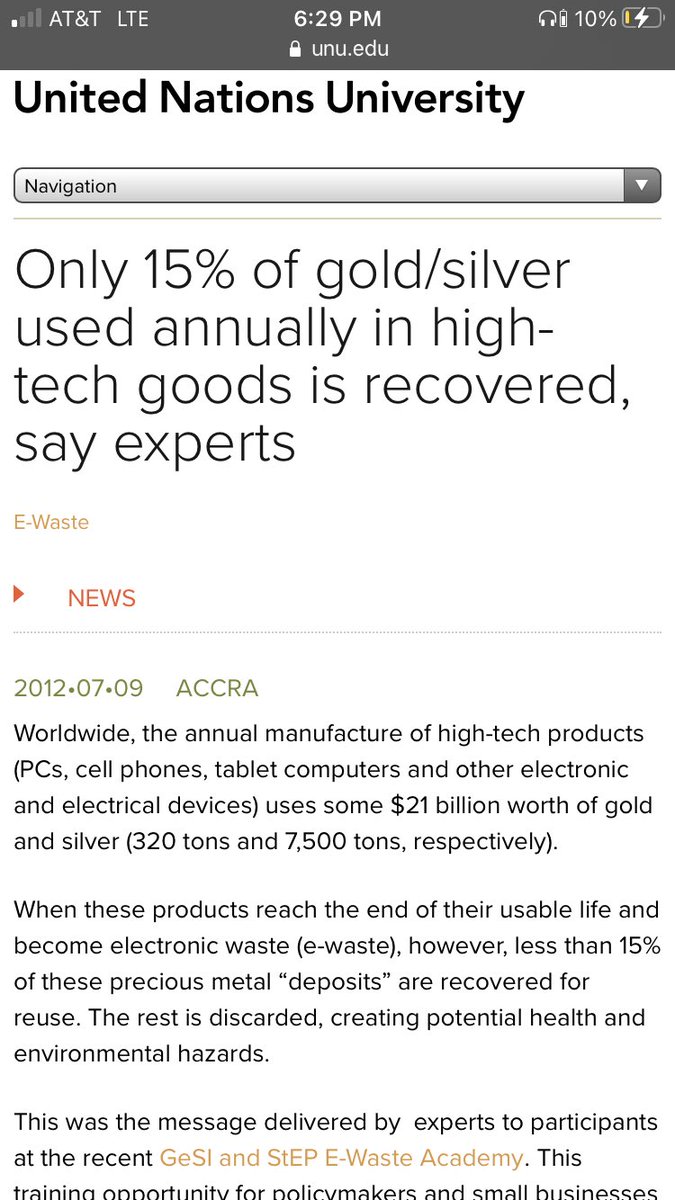
While we throw away tons of silver
What point will we be mining landfills?
8/


Growing industrial uses, specially green energy use in solar panels, electric vehicles and batteries
The ore grade of silver mines are continuing to decline
While we throw away tons of silver
What point will we be mining landfills?
8/
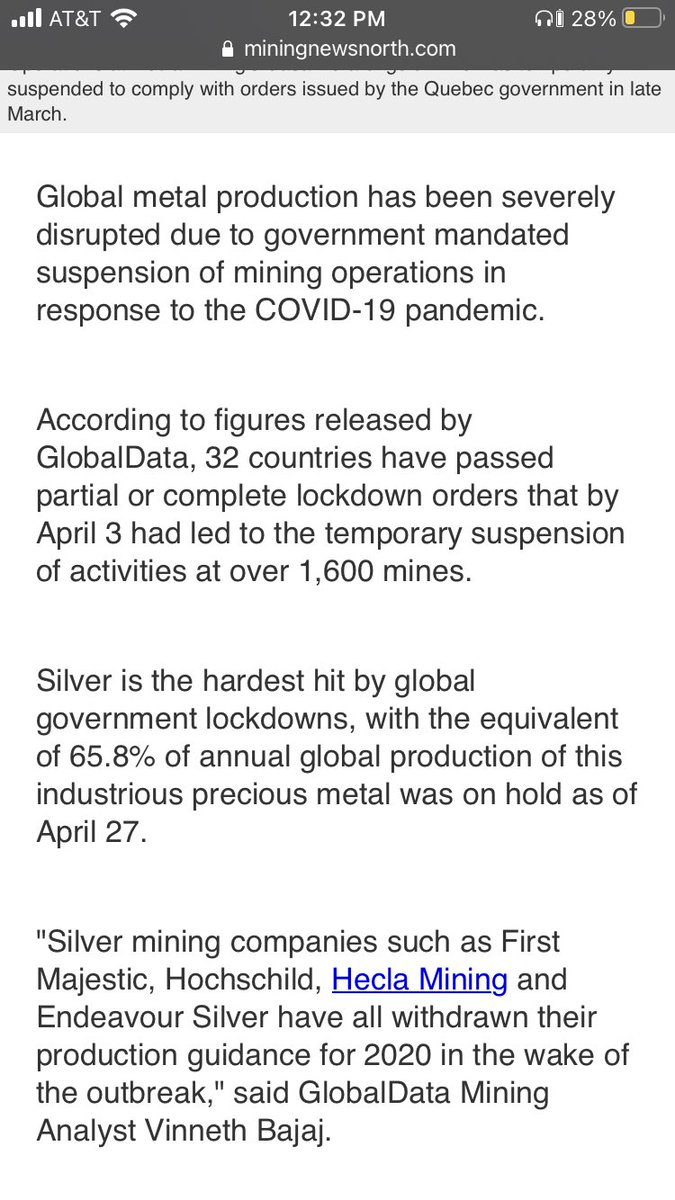
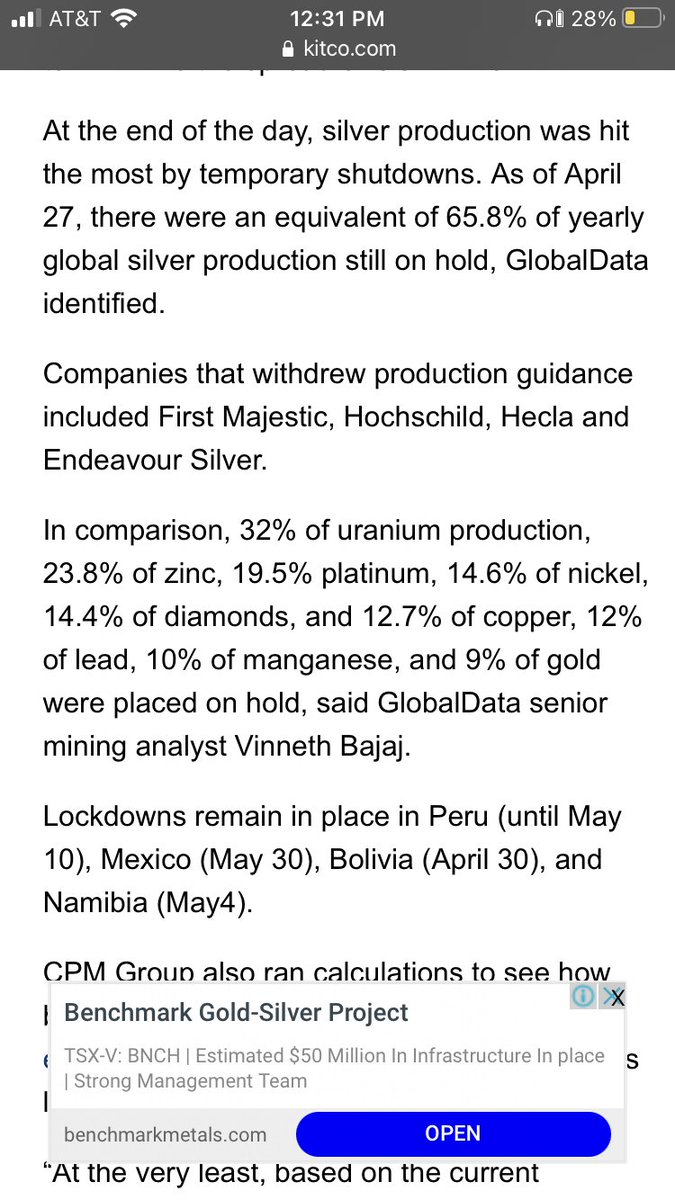
Silver was hit harder by COVID restrictions globally in mines than any other commodity by a wide margin.
#Silver was hit 6x harder than #gold, 5x harder than #copper, 3x worse than #platinum, 2x harder than #uranium
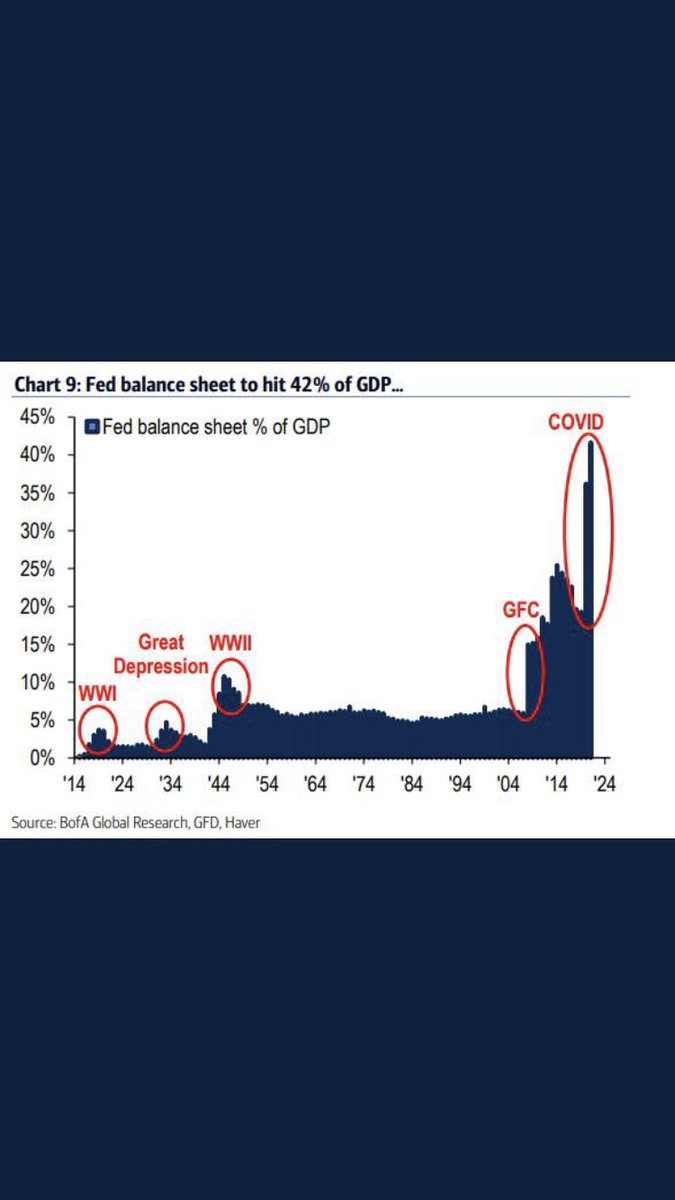
All the while, banks globally printed money like madmen
9/


#Silver was hit 6x harder than #gold, 5x harder than #copper, 3x worse than #platinum, 2x harder than #uranium
All the while, banks globally printed money like madmen
9/
Now down to the #silvershortsqueeze
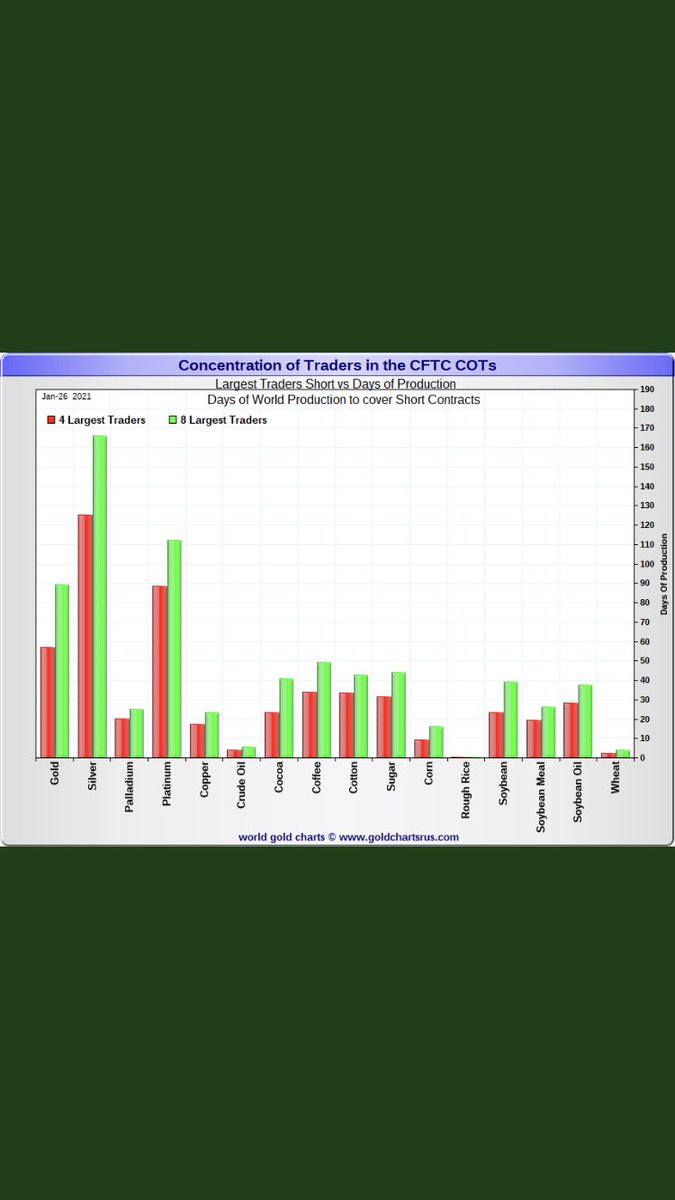
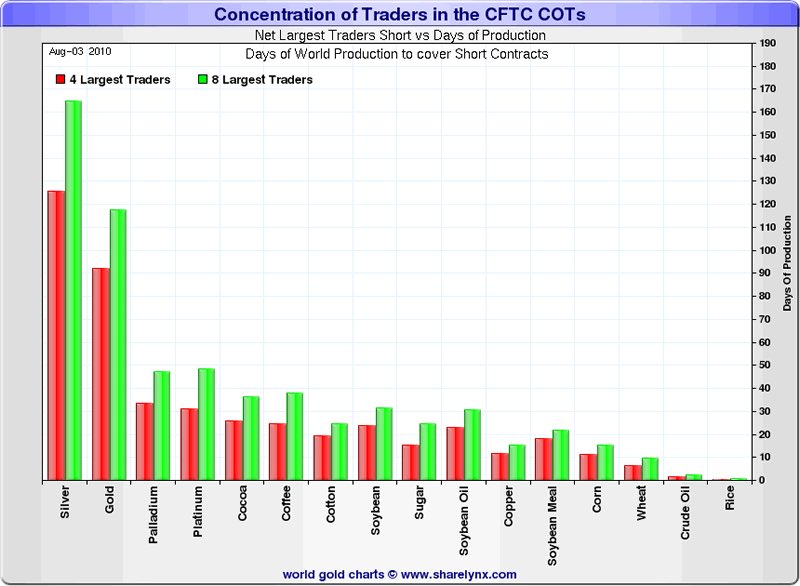
First, the naked shorts and the largest 8 banks
The first chart is current , second chart is from 10 years ago.
Not much has changed.
Silver is far and away the most shorted commodity
10/

First, the naked shorts and the largest 8 banks
The first chart is current , second chart is from 10 years ago.
Not much has changed.
Silver is far and away the most shorted commodity
10/
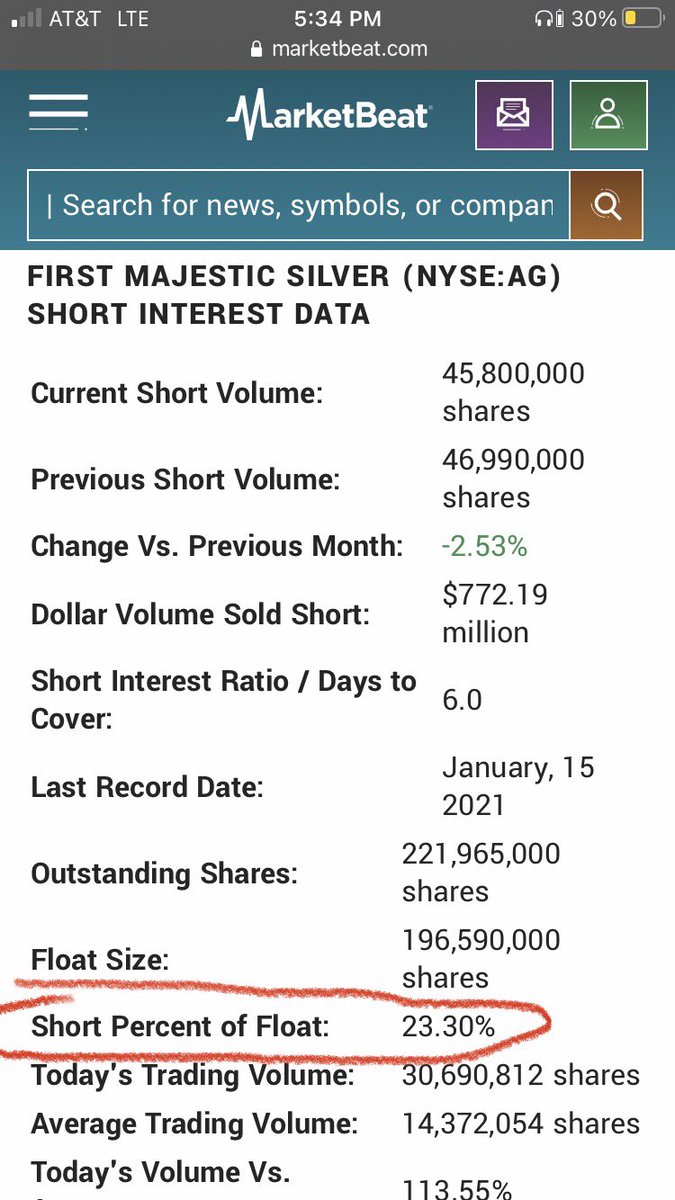
$AG First Majestic Silver, who’s CEO @keith_neumeyer has been very open about the obvious manipulation in the silver market.
His mining company has ~60% revenue from silver and ~40% from gold.
It is also the most shorted stock in the mining sector @ 23.3% of float shorted
11/
His mining company has ~60% revenue from silver and ~40% from gold.
It is also the most shorted stock in the mining sector @ 23.3% of float shorted
11/
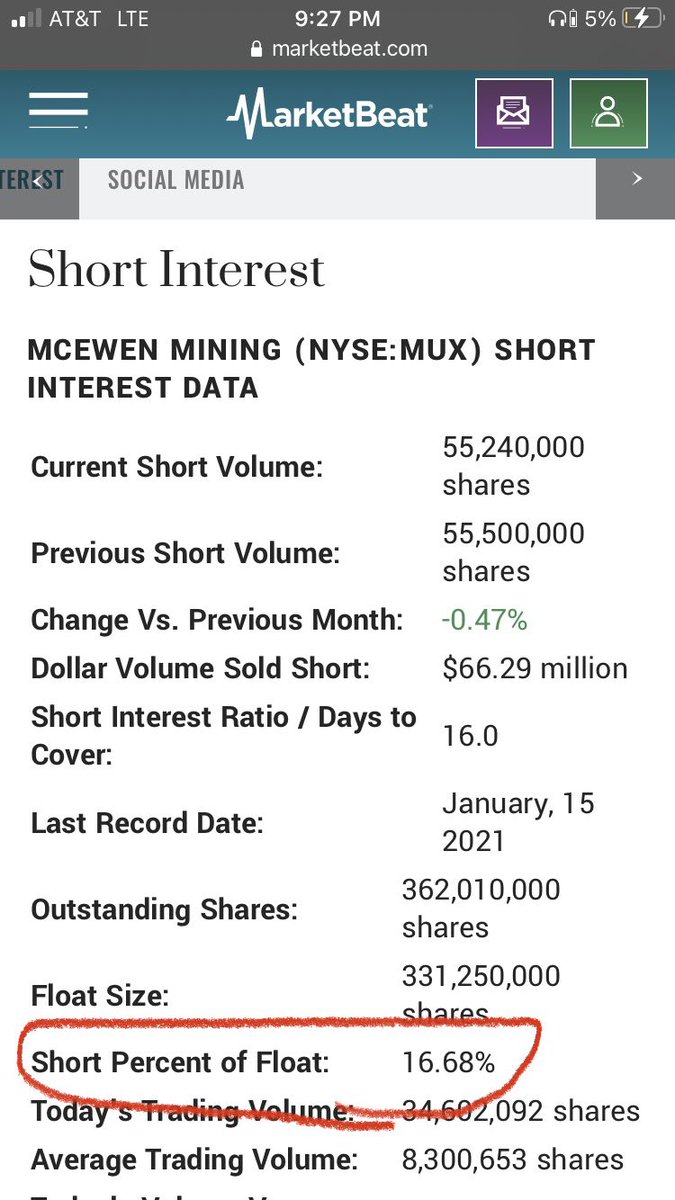
$MUX is the second most shorted mining stock at 16.6% float shorted
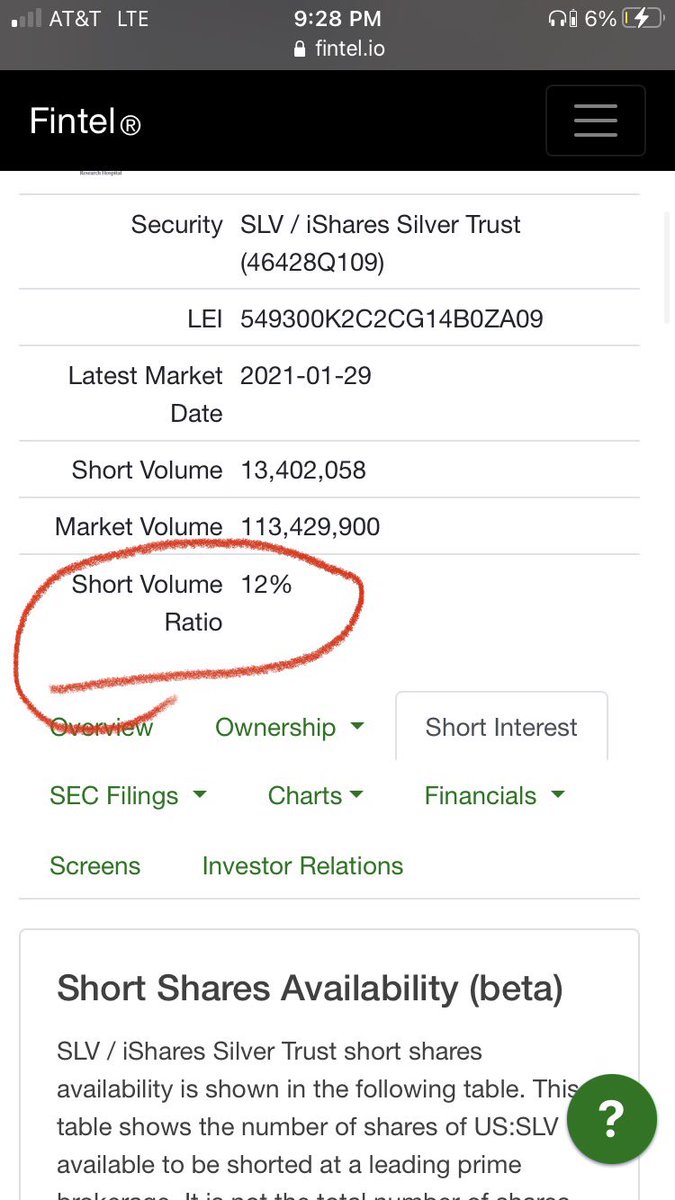
$SLV also has a high short float of 12%
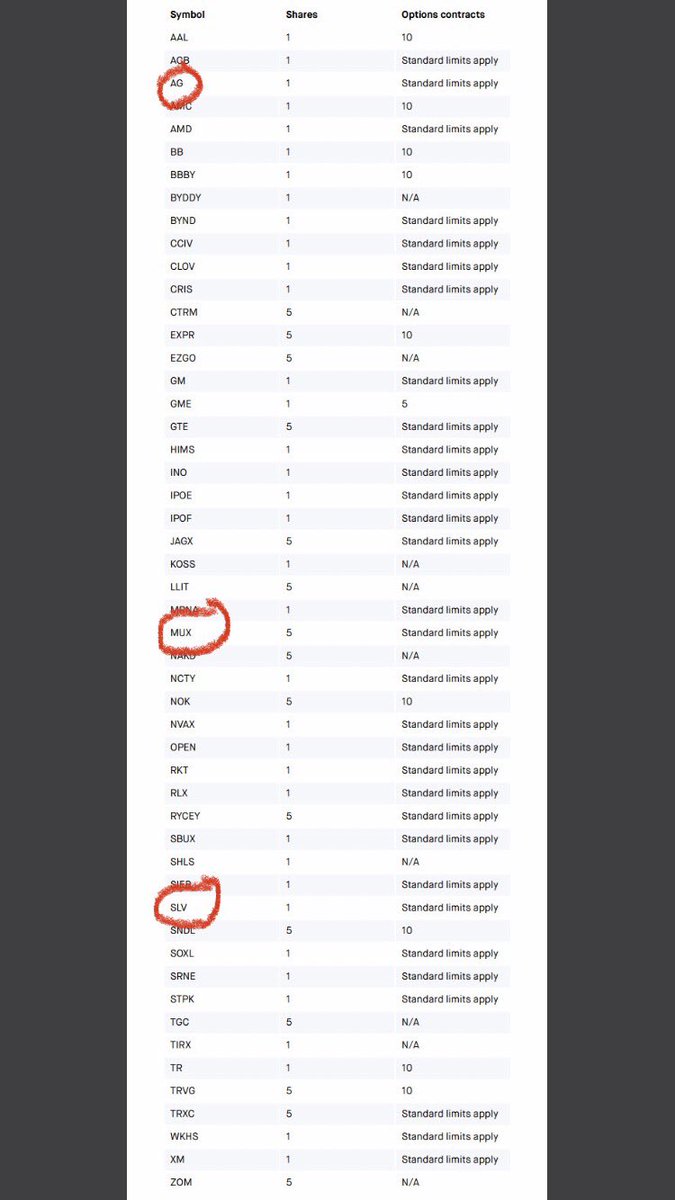
#Robinhood has restricted the buying of $AG $MUX and $SLV hmmm
12/


$SLV also has a high short float of 12%
#Robinhood has restricted the buying of $AG $MUX and $SLV hmmm
12/
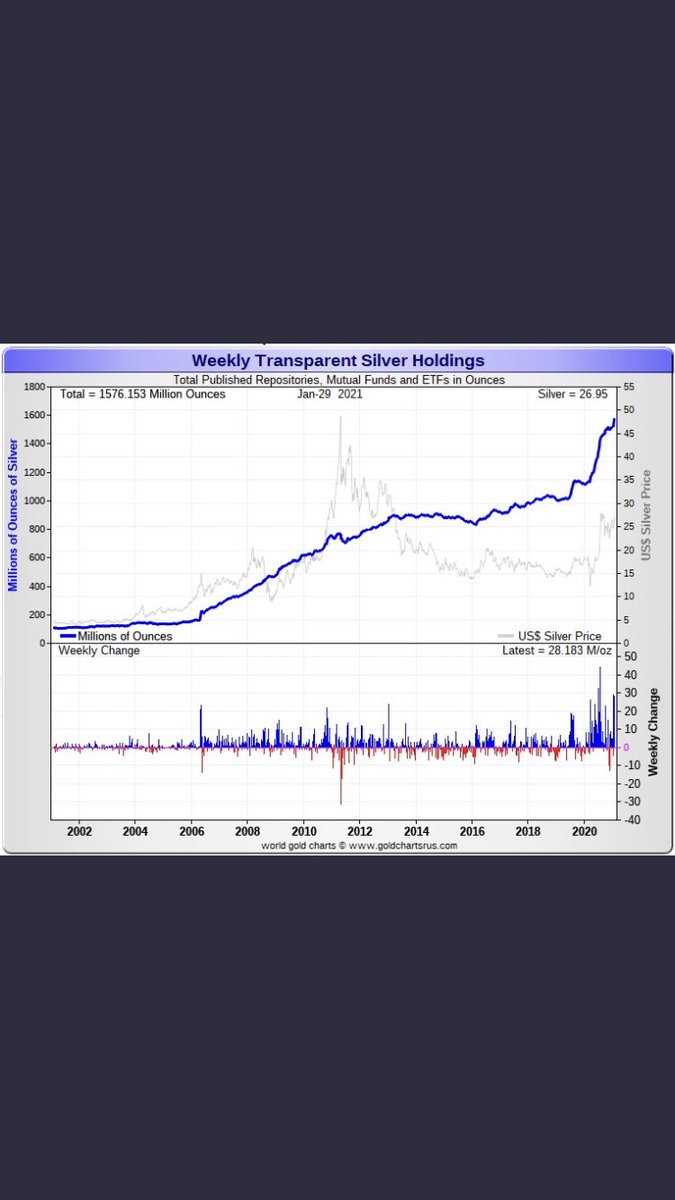
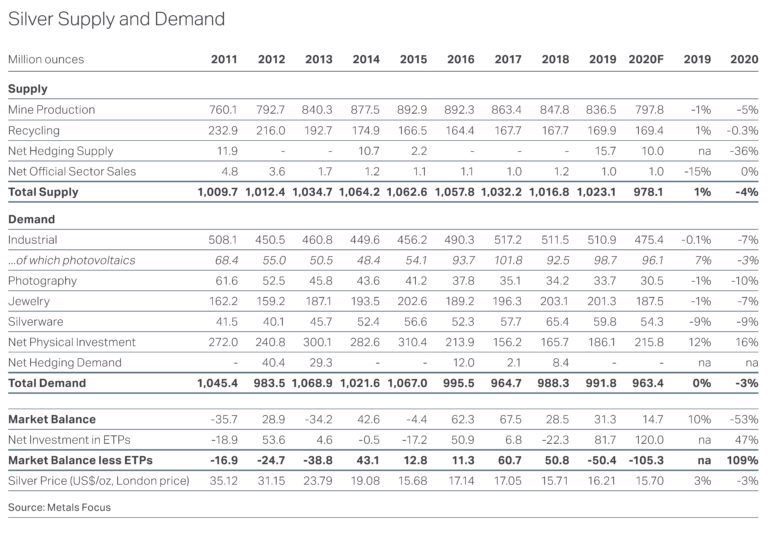
The fraudulent $SLV said they added 34 million+ oz of silver to its depository
That is over 2 weeks of global mine supply bought in one day
Do you really think JP Morgan, admitted criminal silver manipulator truly added 34 million oz of silver to their deposits?
I don’t.
13/

That is over 2 weeks of global mine supply bought in one day
Do you really think JP Morgan, admitted criminal silver manipulator truly added 34 million oz of silver to their deposits?
I don’t.
13/
$GME $AMC $BB will look like child’s play if the short squeeze in the silver market comes to a head.
Long bullion and crypto, short the bankers
Long bullion and crypto, short the bankers
• • •
Missing some Tweet in this thread? You can try to
force a refresh


