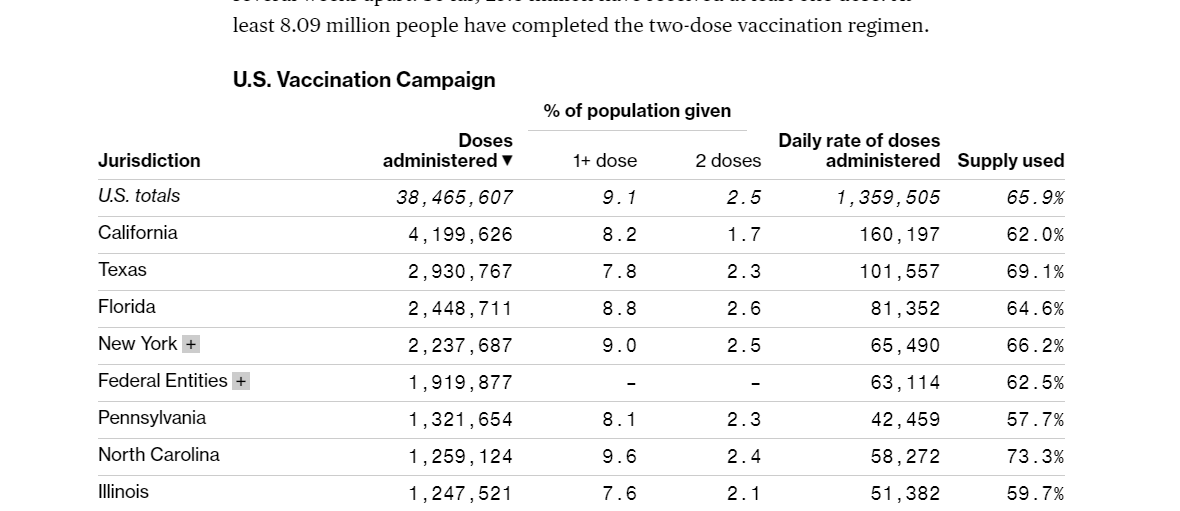
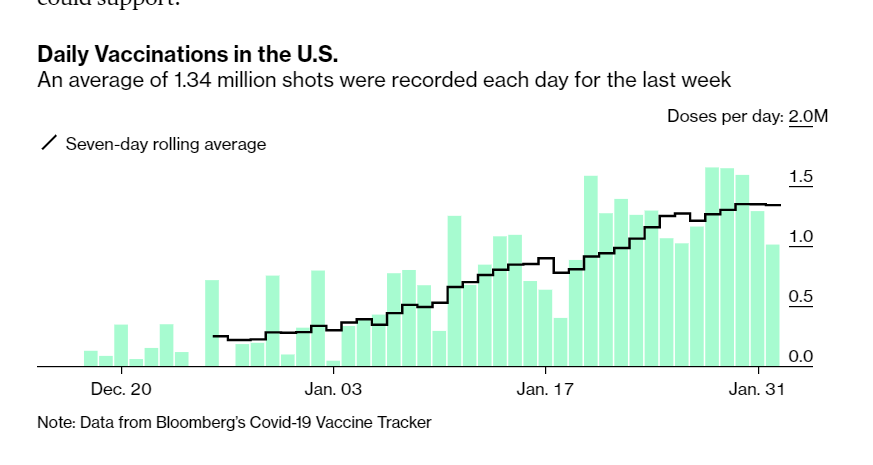
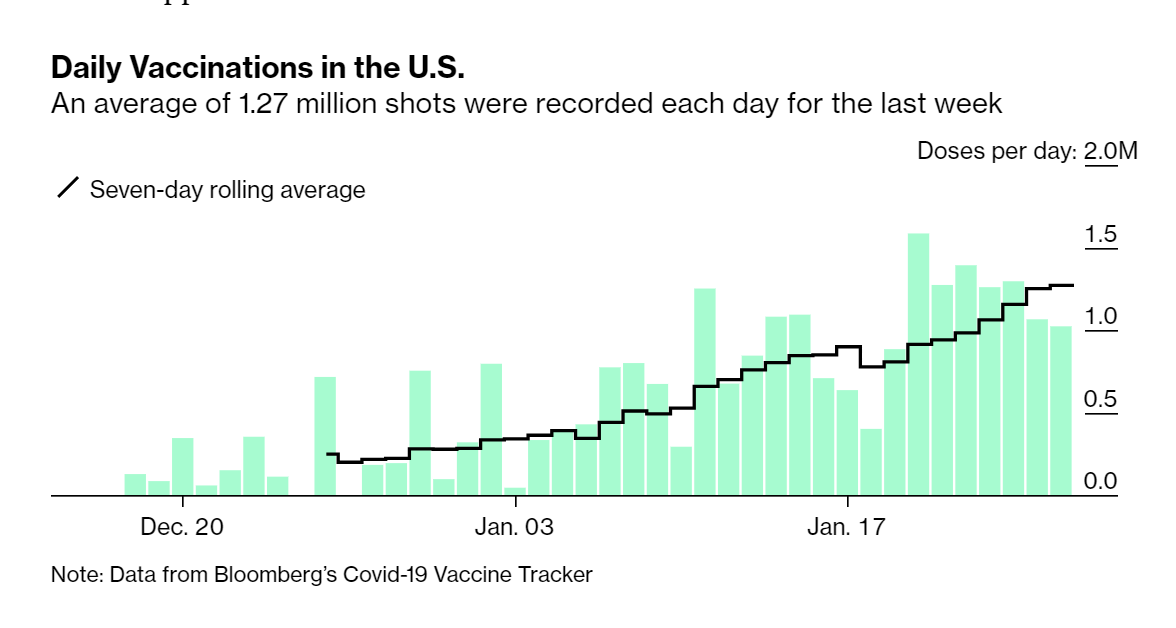
Over the last two days, the U.S. suffered a major drop-off in daily vaccinations reported.
❄️❄️As it turns out, yes, you can blame the snow. ❄️❄️
bloomberg.com/news/articles/…
❄️❄️As it turns out, yes, you can blame the snow. ❄️❄️
bloomberg.com/news/articles/…
Here's how the chart of daily vaccinations counted looks in the reporting period for the storm (data avail on our tracker bloomberg.com/graphics/covid…) 

As @jillrshah reports, many East Coast states basically canceled vaccinations over the last two days as the weather hit. NJ, CT, NY all had vaccination cancelations.
Ditto Maryland, which canceled many appointments. Look at their daily rate chart:
Ditto Maryland, which canceled many appointments. Look at their daily rate chart:

We'll have our daily update out shortly, and we'll see how bad/not bad the impact still is. Standby.
And we will also have -- i am hoping -- a VERY cool tool that will help show some of this.
• • •
Missing some Tweet in this thread? You can try to
force a refresh