
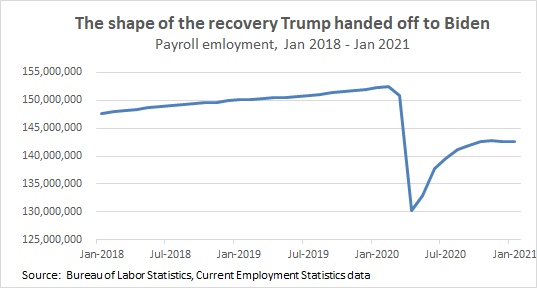
Today is the last #JobsDay with data from the Trump Administration (today’s data are from mid-January). So what does the economy former President Trump handed off to President Biden look like? It’s bleak. 1/
The labor market added just 49,000 jobs in January. And that's likely too rosy—given low seasonal hiring in the pandemic, seasonal adjustments likely made the December numbers look worse than they really were and are making the January numbers look better than they really are. 2/
The average job change of the last three months provides a better sense of current movements, and it was just 29,000. We have 9.9 million fewer jobs than we did before the recession. At *this* pace it would take 29 years to get back to prerecession jobs levels. 3/
Further, in the year before the recession, we added 202,000 jobs per month on average, so since last February, we could have added around 2.2 million jobs. That means the total gap in the labor market right now is on the order of 12 million jobs. 4/
*This* is the shape of recovery Biden has inherited. 5/ 
Another grim finding is that we're down 1.3 million state & local government jobs since last Feb—most of it (nearly 1.0 million) in education. THIS IS A MINDBOGGLING UNFORCED ERROR. Fortunately, given the D majority in the Senate, Congress can pass aid to state & local govts. 6/
At 6.3%, the unemployment rate remains in recessionary territory (it’s as high as the maximum unemployment rate of the in the early 2000s downturn). Further, the unemployment rate is not counting all coronavirus-related job losses. 7/
In January there were 10.1 million workers who were officially unemployed. But there were an additional 0.8 million workers who were temporarily unemployed but who were being misclassified as “employed not a work.” 8/
Further, the total number of workers who were out of work as a result of the virus but were being counted as out of the labor force instead of as unemployed because they weren’t actively seeking work was 5.1 million. 9/
And there are at least another 2.7 million who are unemployed but are not being counted as unemployed because CPS survey nonresponse is nonrandom, and nonresponders are more likely than the general population to be unemployed. 10/
That’s 18.7 million workers who were either unemployed or otherwise out of work as a result of the virus in January. If all these workers were taken into account, the unemployment rate would have been 11.0%. 11/
There are also 6.8 million workers who are employed but have seen a drop in hours and pay as a result of the virus in January. 12/ bls.gov/web/empsit/cov…
So altogether, 18.7 million workers are either unemployed or otherwise out of work because of the virus, and another 6.8 million are employed but have seen a drop in hours and pay, for a total of 25.5 million workers directly hurt by the COVID recession. 13/
That is 15.0% of the workforce—and it doesn’t count those who lost a job or hours earlier in the pandemic but are back to work now. The cumulative count of those harmed would be much greater. 14/
The 25.5 million also ignores the fact that even workers who are employed and haven't had their hours cut are hurt by the crisis. When job openings are scarce, workers’ leverage dissolves. Employers don’t have to pay as well when they know workers don’t have outside options. 15/
And a reminder that it is not true that "everyone" is working from home because of the pandemic—only 23.2% of employed people report having teleworked or worked at home in the last 4 weeks because of the pandemic. That's less than one in four workers. 16/ bls.gov/web/empsit/cov…
January was the 11th month of the COVID crisis, which means long-term unemployment (unemployment lasting more than six months) is spiking. There are now 2.9 million more long-term unemployed workers than there were before the recession. 17/
The impact of this crisis remains highly racially inequitable. The white unemployment rate is 5.7%, the Asian unemployment rate is 6.6%, the Latinx unemployment rate is 8.6%, and the Black unemployment rate is 9.2%. 18/
Our history and present of structural racism dramatically affect the labor market. B/c of things like occupational segregation, discrimination, & other disparities rooted in white supremacy, this crisis is hitting Black and Brown workers far harder than white workers. 19/
What about the big drop in the overall unemployment rate between Dec & Jan? A quick decomposition finds that a little over half of that drop was for “good reasons” (employment going up) & a little less than half was for “bad reasons” (people dropping out of the labor force). 20/
(Wonky note: in that decomposition, I was careful to remove the effects of the new population controls. The exact shares for the decomp are: 56.8% of the drop in unemp was for “good reasons” and 43.4% was for “bad reasons.”) 21/
Fantastic run-down of today's jobs numbers from @eliselgould. epi.org/press/the-u-s-…
We all know the official unemployment numbers understate the pain in the labor market. But exactly how many workers were hurt by this crisis in January? Over 25 million. This post walks through the missing factors in the official data. 23/ epi.org/blog/the-econo…
• • •
Missing some Tweet in this thread? You can try to
force a refresh


