0/ This is a 🧵about my experiences building both the Distributed Tracing and Metrics infra at Google.
And, particularly, my regrets. :)
Here goes: 👇
And, particularly, my regrets. :)
Here goes: 👇
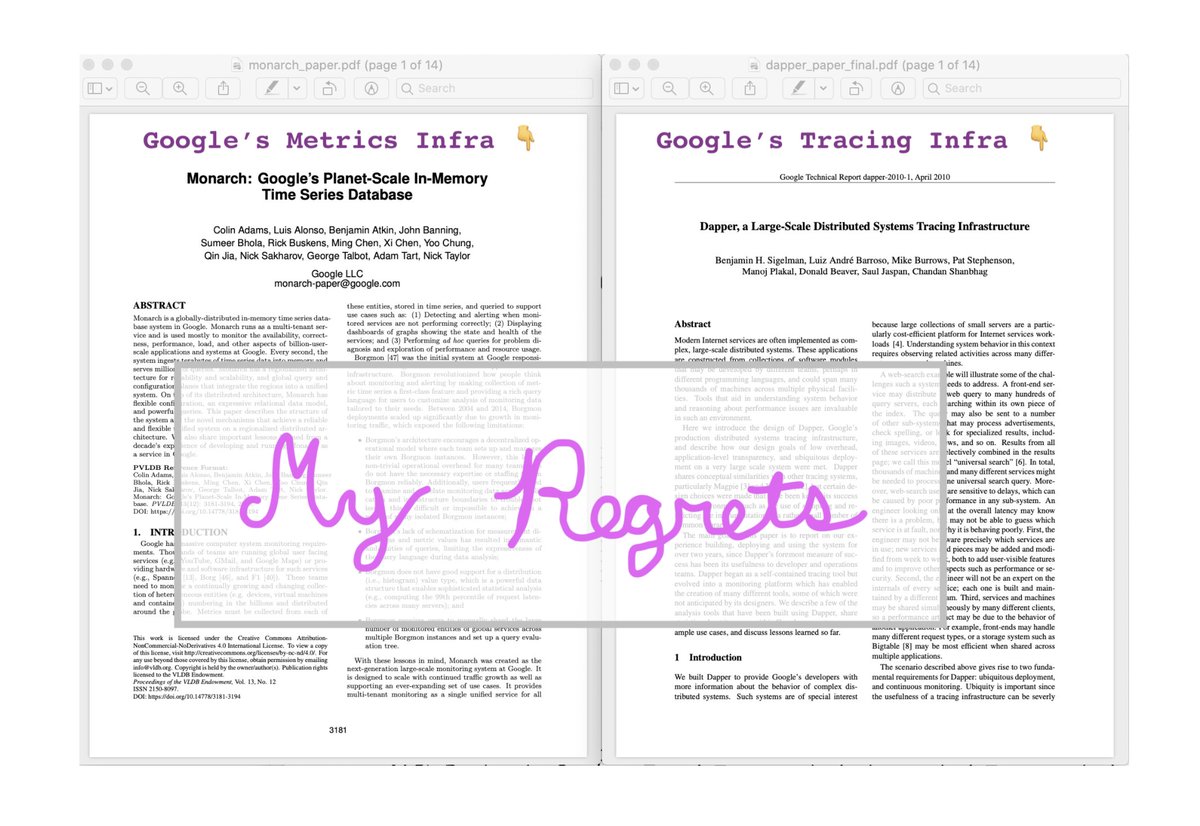
1/ Dapper certainly did some fancy tricks, and I’m sure it still does. If it’s possible to fall in love with an idea or a piece of technology, that’s what happened with me and Dapper. It wasn’t just new data, it was a new *type* of data – and lots of it. So. Much. Fun. …
2/ … And yet: early on, *hardly anybody actually used it.*
Dapper was certainly _valuable_ (we saved GOOG untold $10Ms in latency improvements alone) but not “day-to-day essential.” Why?
Dapper was certainly _valuable_ (we saved GOOG untold $10Ms in latency improvements alone) but not “day-to-day essential.” Why?
3/ Dapper’s early-days usage issues boiled down to two core challenges:
a) The insights were *restricted to the tracing (span) telemetry*
b) Those insights could only be accessed *from Dapper.* (And hardly anybody “started” in Dapper from a UX standpoint)
a) The insights were *restricted to the tracing (span) telemetry*
b) Those insights could only be accessed *from Dapper.* (And hardly anybody “started” in Dapper from a UX standpoint)
4/ Eventually we did make some progress (e.g., @JMacDee1’s brilliant integration into Google’s /requestz – the ancestor of OpenCensus zpages: opencensus.io/zpages/#tracez).
Yet it still didn’t feel like Dapper was vital, can’t-live-without-it technology for most SREs and devs.
Yet it still didn’t feel like Dapper was vital, can’t-live-without-it technology for most SREs and devs.
5/ Now, rather than step back to think about *how* we might harvest the insights from Dapper and integrate them into daily workflows, we let the project “evolve in place” – and I regret that.
Anyway, I wanted to work on something “more P0,” so I talked with lots of SREs.
Anyway, I wanted to work on something “more P0,” so I talked with lots of SREs.
6/ At the time, what tool *did* every SRE at Google use every day?
Borgmon.
And what tool caused every SRE at Google endless frustration and pain?
Also borgmon.
So we created Monarch: scalable, HA monitoring that was also, well, *usable*. vldb.org/pvldb/vol13/p3…
Borgmon.
And what tool caused every SRE at Google endless frustration and pain?
Also borgmon.
So we created Monarch: scalable, HA monitoring that was also, well, *usable*. vldb.org/pvldb/vol13/p3…
7/ The complete story about Monarch’s early days is an interesting one, but it will have to wait for a different thread/post (too long!). What I would emphasize, though, is that Monarch only tried to solve the *monitoring* problem, not the *observability* problem.
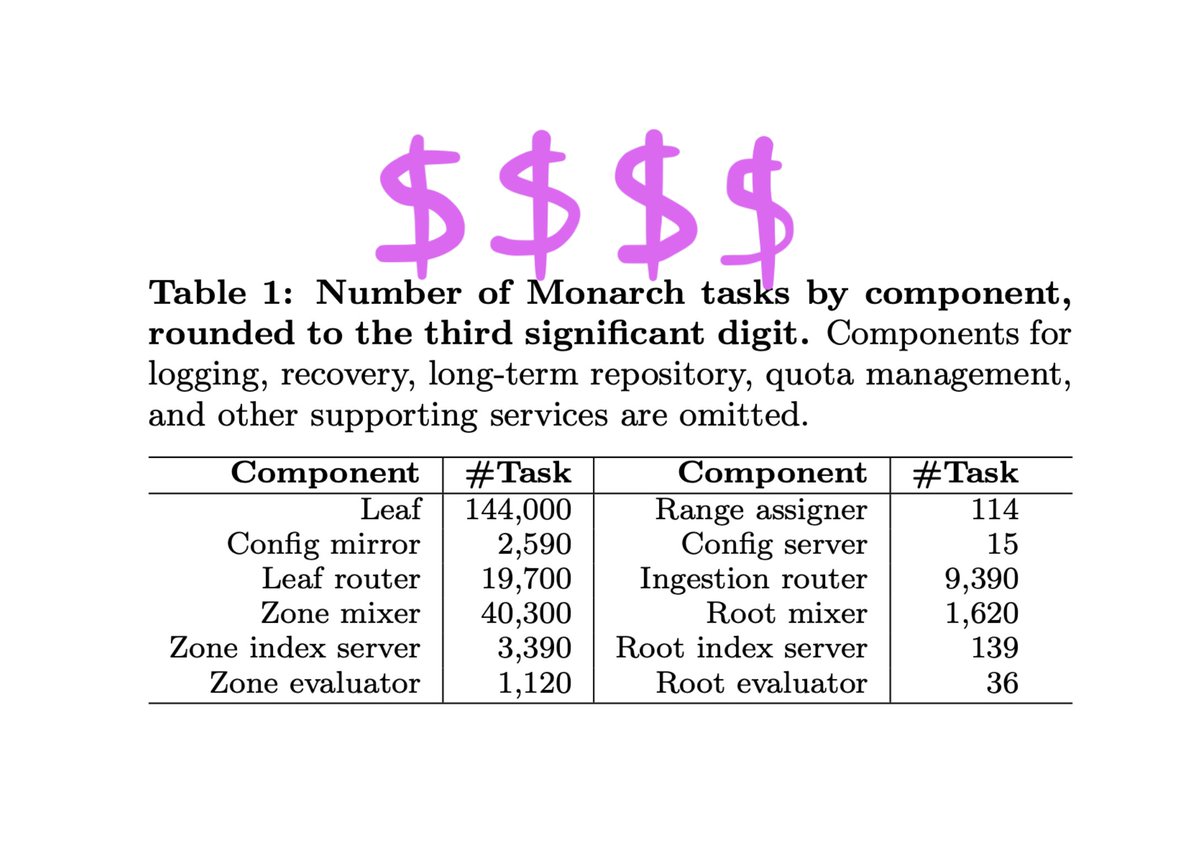
8/ And while I am proud of the team’s technical accomplishments (Monarch is a *vast* system: over 220,000 (!) processes in steady-state), I regret that we stopped at “monitoring.” Why did such an *expensive* system have such limitations?
Correction: I *really* regret that.
Correction: I *really* regret that.
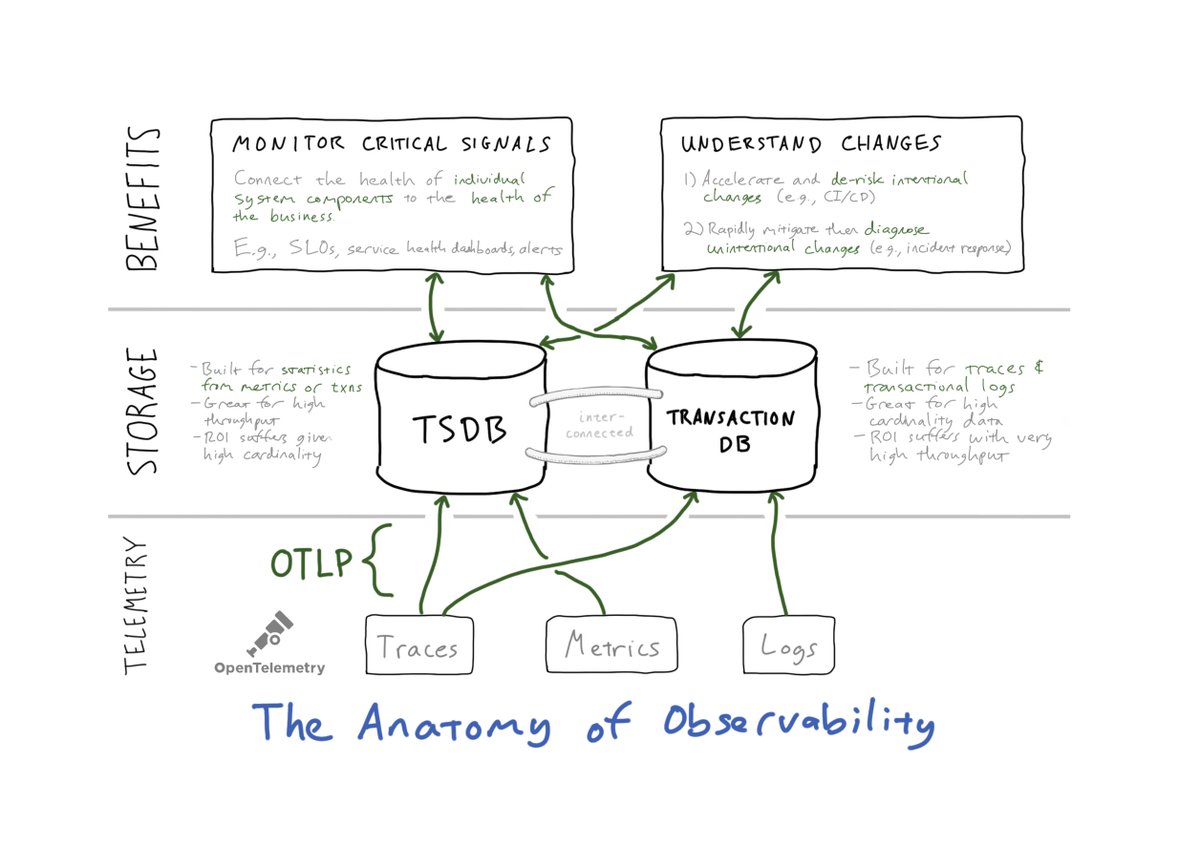
9/ So what would a scalable, HA monitoring product look like if observability was built into its fabric, into its very infrastructure? If monitoring was there to measure critical signals, and observability was there to explain changes to those signals?
10/ (TBH, we never even *tried* to build that at Google… though admittedly it would have been very difficult to take on given all of the hurdles that large companies bring to any and every development process.)
11/ So, ultimately, of course there were ∞ small regrets, and two *big* regrets:
I) We built Dapper to find patterns in traces, but we failed to make those findings *discoverable.*
II) We built Monarch for core monitoring, but we failed to make that monitoring *actionable.*
I) We built Dapper to find patterns in traces, but we failed to make those findings *discoverable.*
II) We built Monarch for core monitoring, but we failed to make that monitoring *actionable.*
12/ Why am I telling this story now?
Well, this week, after years of effort and experimentation, we at @LightstepHQ are ready to share some news.
And this time, I have no regrets. :)
Take a look…
Architecture: thenewstack.io/observability-…
Product: lightstep.com/blog/announcin…
Well, this week, after years of effort and experimentation, we at @LightstepHQ are ready to share some news.
And this time, I have no regrets. :)
Take a look…
Architecture: thenewstack.io/observability-…
Product: lightstep.com/blog/announcin…
• • •
Missing some Tweet in this thread? You can try to
force a refresh