0/ When large eng orgs rely on metrics for both monitoring *and* observability, they struggle with cardinality.
This is a thread about “the two drivers of cardinality.” And which one of those we should kill. :)
🧵👇
This is a thread about “the two drivers of cardinality.” And which one of those we should kill. :)
🧵👇

1/ Okay, first off: “what is cardinality, anyway?” And why is it such a big deal for metrics?
“Cardinality” is a mathematical term: it’s *the number of elements in a set*... boring! So why tf does anybody care??
Well, because people think they need it, then suddenly, "$$$$$$$."
“Cardinality” is a mathematical term: it’s *the number of elements in a set*... boring! So why tf does anybody care??
Well, because people think they need it, then suddenly, "$$$$$$$."
2/ When a developer inserts a (custom) metric to their code, they might think they’re just adding, well, *one metric*. …
3/ … But when they add “tags” to that metric – like <version>, <host>, or (shiver) <customer_id> – they are actually creating a *set* of metric time series, with the *cardinality* of that set being the total number of unique combinations of those tags.
4/ The problem is that some of those tags have many distinct values.
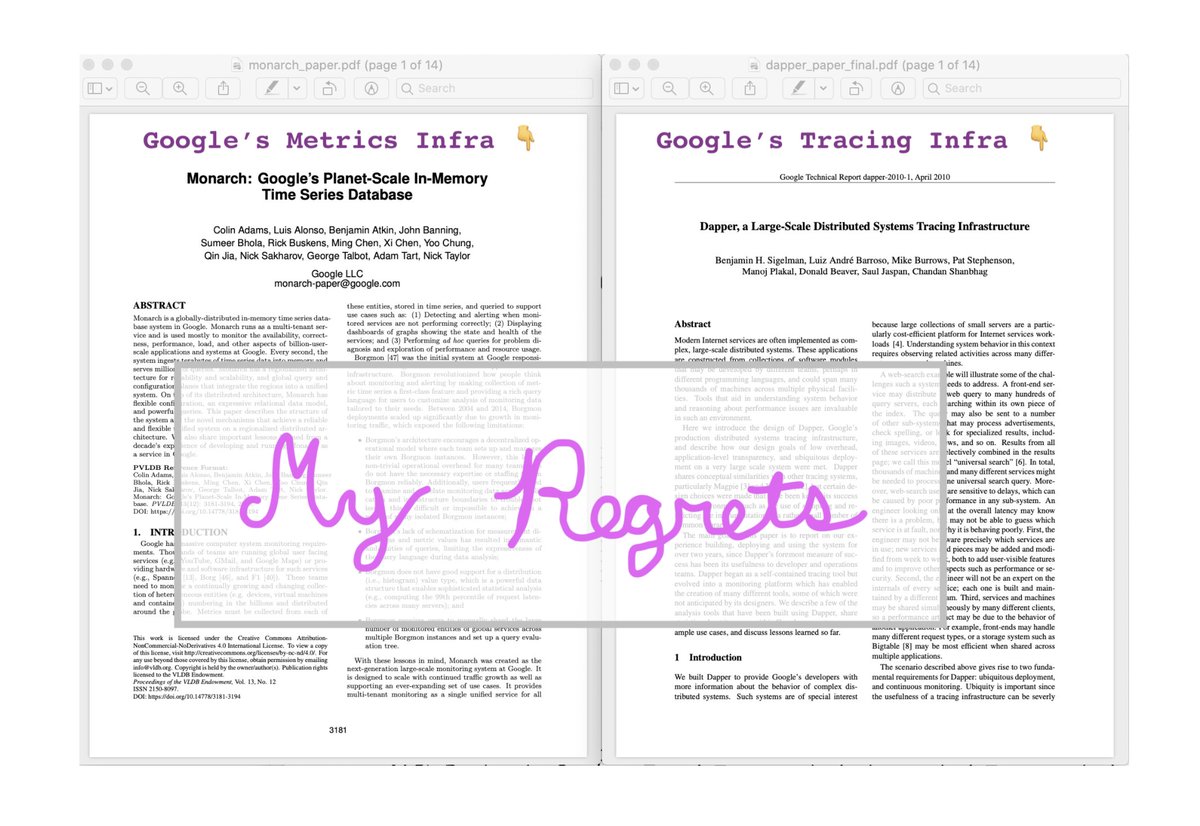
E.g., when I was working on Monarch at Google, there was a single gmail metric that became over 300,000,000 (!!!) distinct time series. In a TSDB, that cardinality is the unit of cost.
So again, “$$$$$$$.”
E.g., when I was working on Monarch at Google, there was a single gmail metric that became over 300,000,000 (!!!) distinct time series. In a TSDB, that cardinality is the unit of cost.
So again, “$$$$$$$.”
5/ Okay, so that’s why people care about metrics cardinality. Now, what are the two *drivers* of that cardinality?
A) Monitoring: more detailed *health measurements*
B) Observability: more detailed *explanations of changes*
Let’s take these one at a time…
A) Monitoring: more detailed *health measurements*
B) Observability: more detailed *explanations of changes*
Let’s take these one at a time…
6/ First, “More Detailed Health Measurements” (monitoring):
Consider an RPC metric that counts errors. You need to independently monitor the error rate for different methods. And so – voila – someone adds a “method” tag, and now there’s 10x the cardinality for that metric.
Consider an RPC metric that counts errors. You need to independently monitor the error rate for different methods. And so – voila – someone adds a “method” tag, and now there’s 10x the cardinality for that metric.
7/ … And also 10x the cost. But that’s justifiable, as there’s a business case for independently monitoring the reliability of distinct RPC methods.
Put another way, you might rightly have different error budgets for different RPC methods, so their statistics must be separable.
Put another way, you might rightly have different error budgets for different RPC methods, so their statistics must be separable.
8/ Bottom line: When it comes to “measuring health,” we often *need* cardinality in order to hone in on the signals we actually care about. Increasing cardinality to *proactively* monitor the signals we care most about is usually a worthwhile tradeoff.
9/ Now what about using cardinality for “More Detailed Explanations of Changes?”
This is the real culprit! And, frankly, should be abolished. :) Metrics cardinality is the wrong way to do observability – to explain changes.
More on that…
This is the real culprit! And, frankly, should be abolished. :) Metrics cardinality is the wrong way to do observability – to explain changes.
More on that…
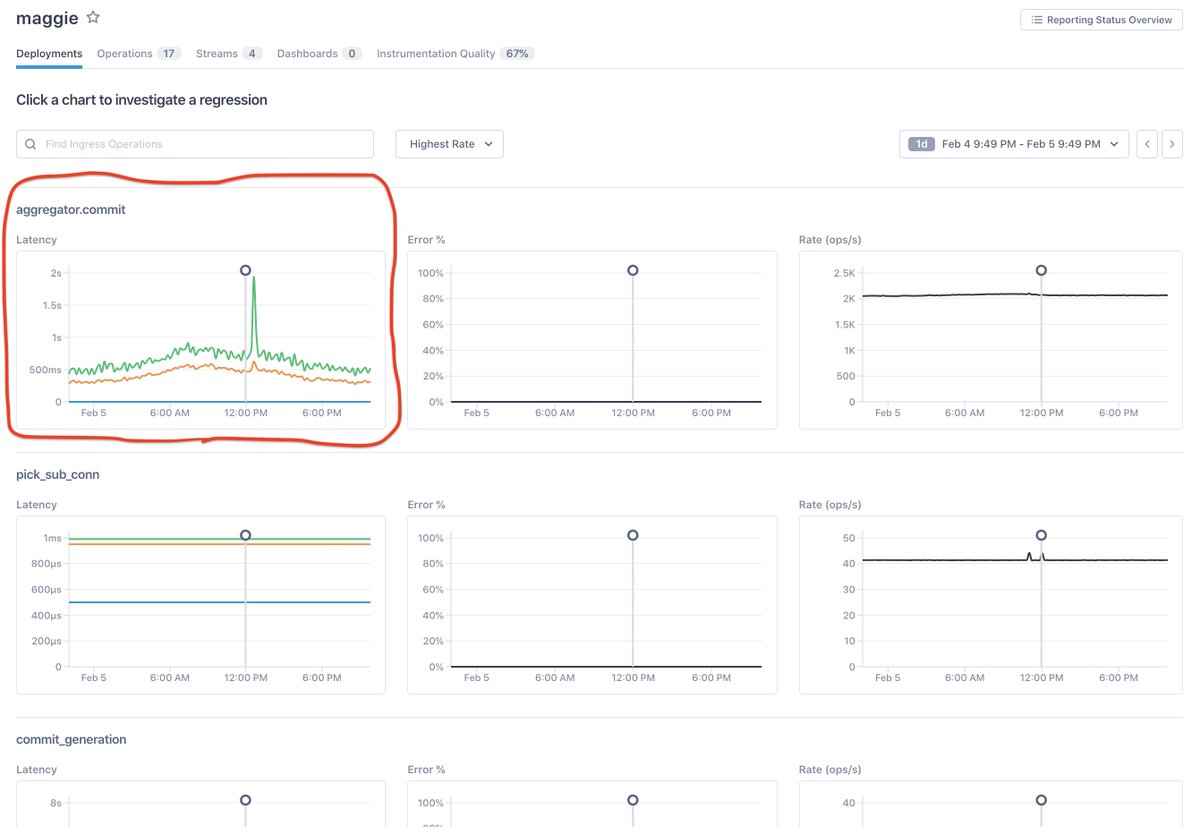
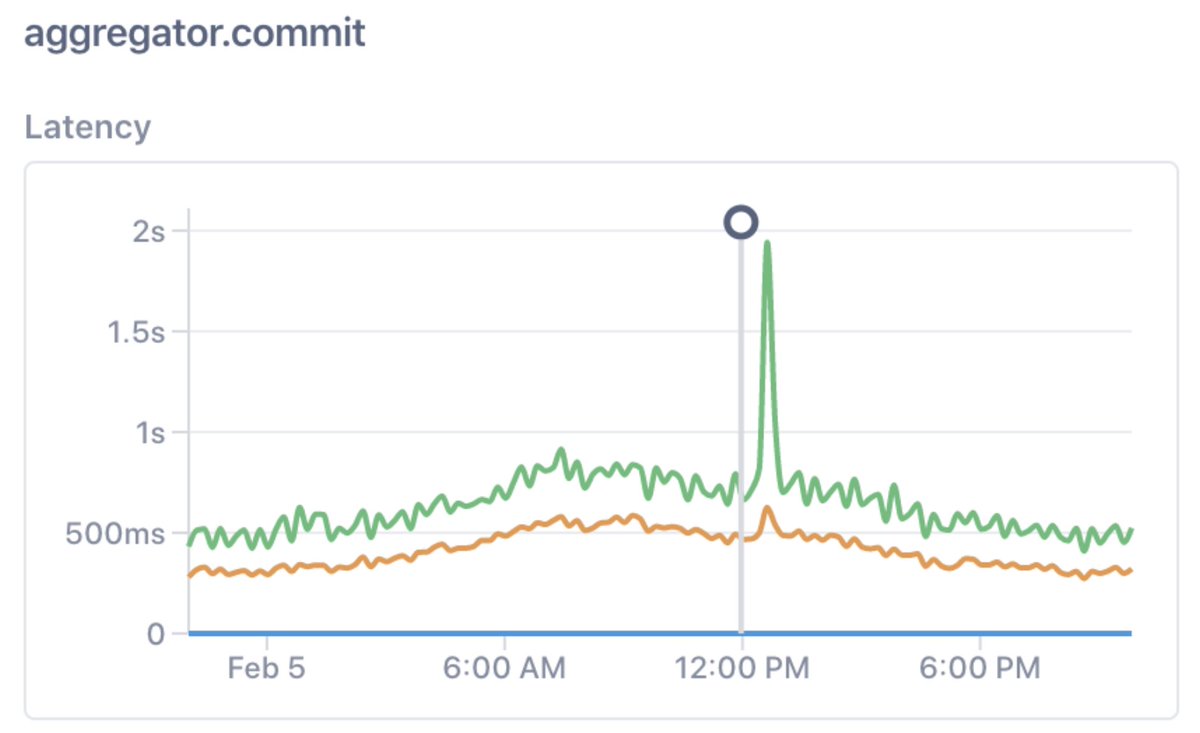
10/ Say your monitoring tells you that there’s a problem with a critical symptom – e.g., you’re suddenly burning through an SLO error budget at an unsustainable clip.
11/ After a painful outage, say you realize a single customer DOSed your service. So someone adds a `customer` tag “for next time.”
But this is unsustainable: each incident reveals a new failure mode, devs keep adding tags, and before long your metrics bill is out of control.
But this is unsustainable: each incident reveals a new failure mode, devs keep adding tags, and before long your metrics bill is out of control.
12/ The problem, in a nutshell:
Distributed systems can fail for a staggeringly large number of reasons. *You can't use metrics cardinality to isolate each one.*
Distributed systems can fail for a staggeringly large number of reasons. *You can't use metrics cardinality to isolate each one.*
13/ How *should* we explain changes to production systems?
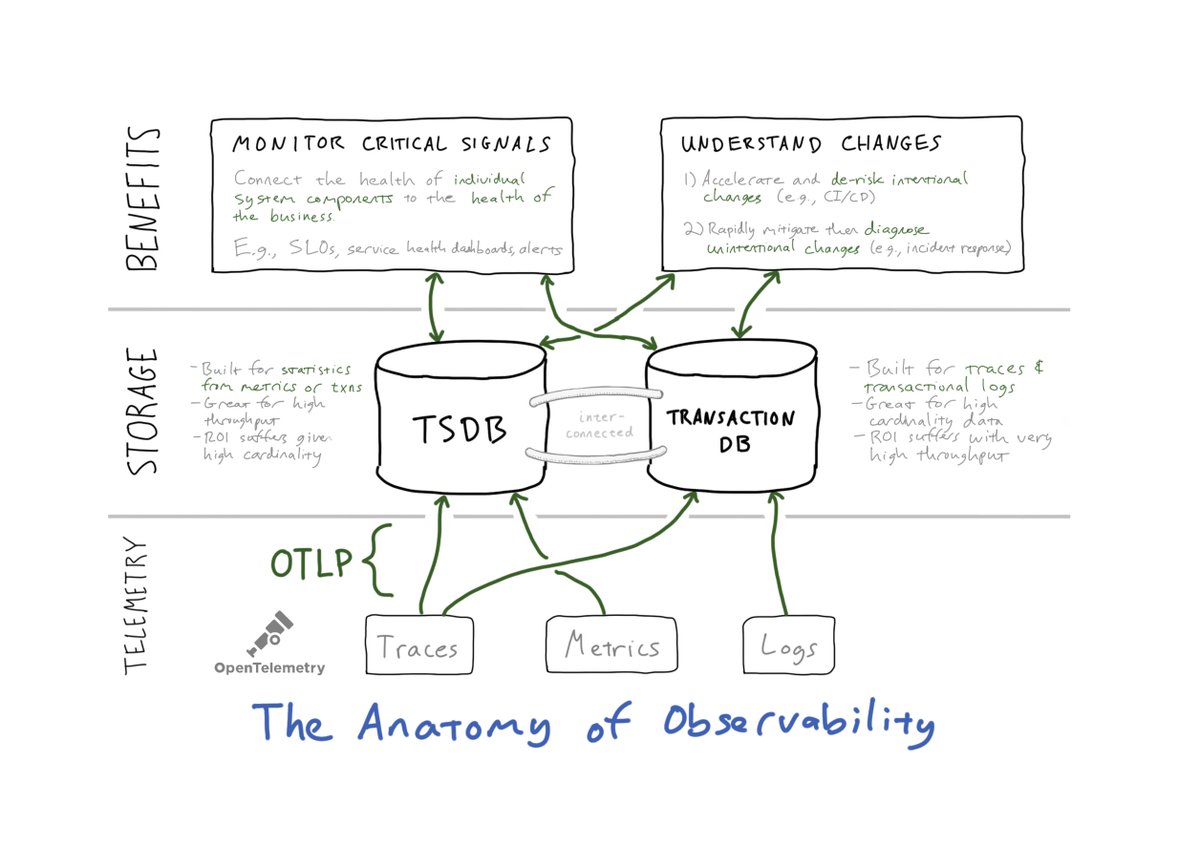
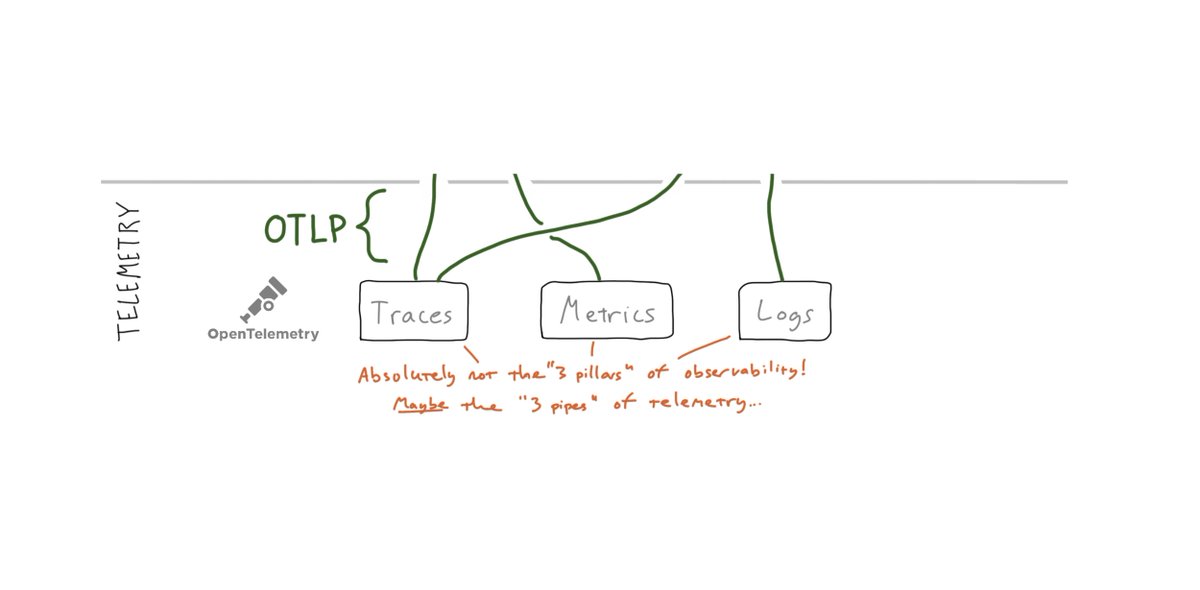
Understanding change is the central problem of observability. Effective workflows might *start* with metrics, but they must pivot towards a multi-telemetry, multi-service guided analysis.
Understanding change is the central problem of observability. Effective workflows might *start* with metrics, but they must pivot towards a multi-telemetry, multi-service guided analysis.
14/ So, to sum up: spend your limited cardinality budget on *monitoring*, and then look for observability that (a) naturally explains changes and (b) relies on transactional data sources that do not penalize you for high/unbounded cardinality.
15/ PS: For more on how to distinguish monitoring and observability, see this thread:
PPS: If you’d like to discuss/debate/request-more-detail any of the above, reply to this thread or DM me!
https://twitter.com/el_bhs/status/1349406398388400128
PPS: If you’d like to discuss/debate/request-more-detail any of the above, reply to this thread or DM me!
• • •
Missing some Tweet in this thread? You can try to
force a refresh