
0/ Sometimes we should philosophize about observability.
And sometimes we should just get pragmatic and examine real-world use cases in real-world systems! So here is a simple example of what cutting-edge observability can do today.
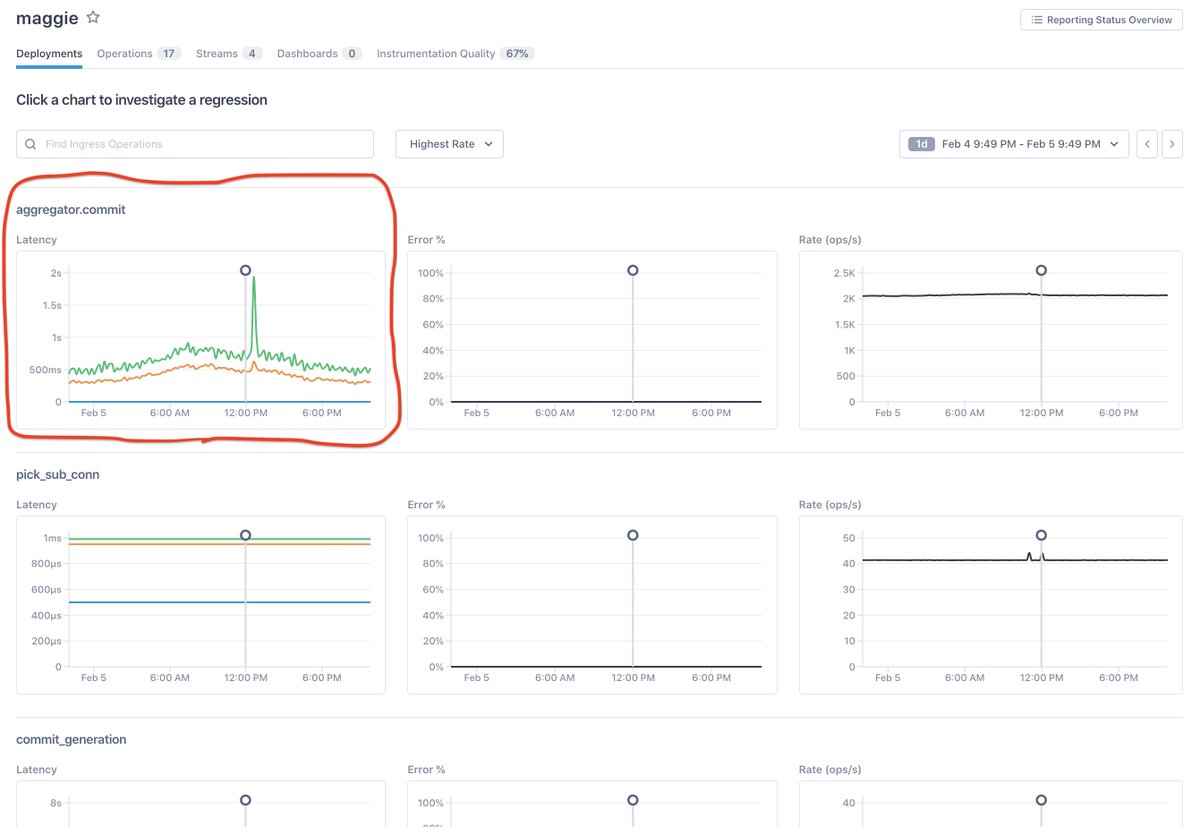
We begin with an SLI that looks off…
And sometimes we should just get pragmatic and examine real-world use cases in real-world systems! So here is a simple example of what cutting-edge observability can do today.
We begin with an SLI that looks off…
1/ A quick prologue: this real-world example comes from @LightStepHQ’s meta-monitoring (of our own SaaS). This way I can show real data at scale (Lightstep customers generate billions of traces every hour!!) without needing approval from customer eng+PR departments.
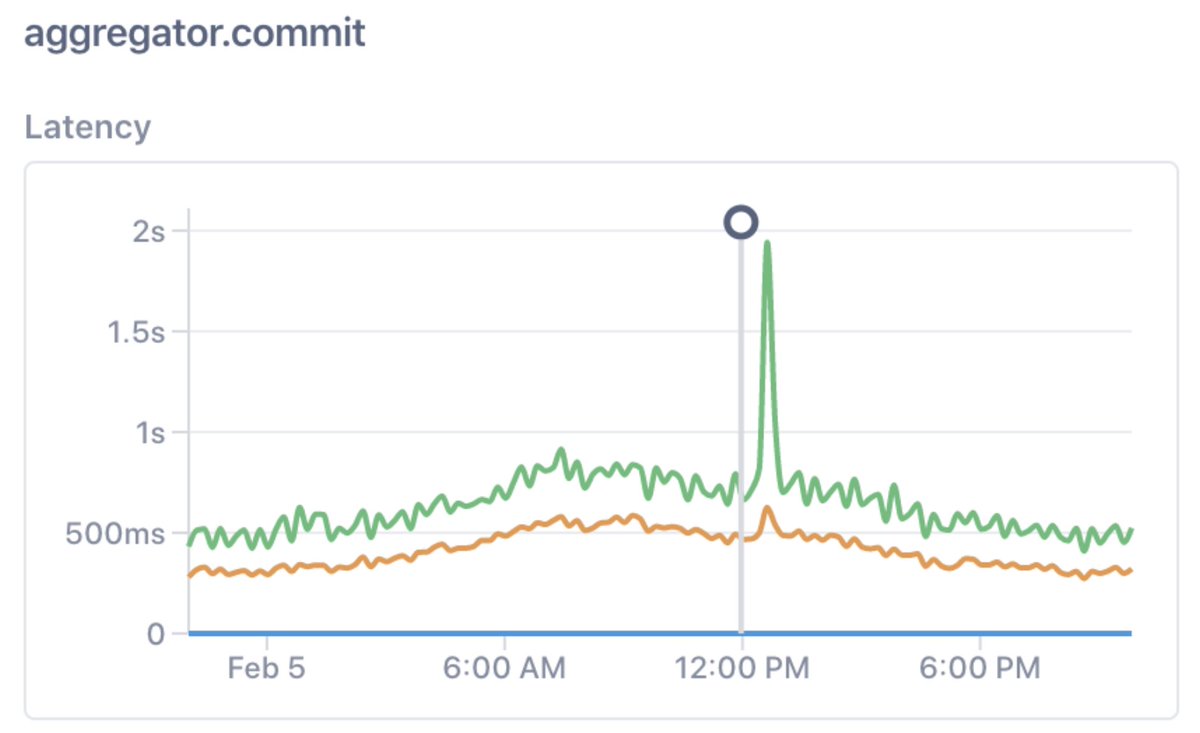
2/ So, we run a microservice called “maggie” (stands for “m”etrics “agg”regator). It had this weird blip at about 12:30pm. That’s not supposed to happen, so the obvious question is “why?”
3/ Rather than scrolling off into other dashboards, we really just want to click on the regression.
So let’s just do the simple thing and click on it:
So let’s just do the simple thing and click on it:

4/ Ah, lovely. So, we now compare this regression (yellow) to a baseline (blue).

5/ So far, we’ve only told our tooling *what problem we’re solving.*
This analysis needs to consider the *entire* deep system (and its many layers), not just the “maggie” service. Historically, this was a painful, manual process. Here, it’s not!
This analysis needs to consider the *entire* deep system (and its many layers), not just the “maggie” service. Historically, this was a painful, manual process. Here, it’s not!
6/ The explanation could come from any upstream or downstream service. LightStep’s hypothesis-driven sampling allows it to build custom populations of traces for both the baseline and the regression datasets; all of these traces touch the “maggie -> aggregator.commit” operation.

7/ (Side note: there are more traces in the regression window because the engine understands that an anomaly is happening and dynamically increases the population size to bolster the subsequent analysis)
8/ Since we’re looking at a performance regression, we are presented with a detailed side-by-side of baseline vs regression performance. Note that *the tool has already identified tags and services that appear highly-correlated with critical path latency*:

9/ And now things are actually pretty obvious. If we mouseover the top suggested correlated tag, we see that a specific Kafka topic is responsible for essentially all of the latency regression.

10/ So we *already* have extremely clear evidence that the “public-lightweight-aggregate” Kafka topic is correlated with latency. But where does that crop up in the actual distributed system? This diagram addresses that aspect:

11/ We can see that calls going through sarama (a golang Kafka client we use) represent a *250ms regression* in the critical path latency! And again, this data is statistically sound, built from a statistical analysis of thousands of traces and *their* critical paths.
12/ It’s worth mentioning that the system overall is much larger and deeper than what’s here – but observability is about narrowing focus to the pieces of the system that are actually relevant to the current investigation. So that’s what’s done here.
13/ If we want to drill into specific traces to understand things in more detail, that’s always possible, too. We can click on any of the tag or operation correlations to get a list of example traces:

14/ And if we drill down into one of those traces, we can see all of the detail about the critical path. We can even see the logging statements that came from that transaction:

15/ So, stepping back, we’ve gone from a troubling symptom – a latency regression in an important SLI – to not just one but _many_ vantage points on the particular part of the system (Kafka) *and* the data (a particular topic) correlated with the anomaly.
16/ This benefited from “All The Telemetry”: metrics, vanilla logs, and several thousand traces that were specifically sampled and analyzed.
But it’s not about that: it’s about the end-user clicking on something that looked wrong, and observability that can explain why.
But it’s not about that: it’s about the end-user clicking on something that looked wrong, and observability that can explain why.


