Want to know which countries fake their daily reported numbers of Covid19 cases and deaths? π§
I tested each country for underdispersion relative to the Poisson model: github.com/dkobak/excess-β¦. If the variance is lower than the Poisson variance, something is fishy (pun intended).
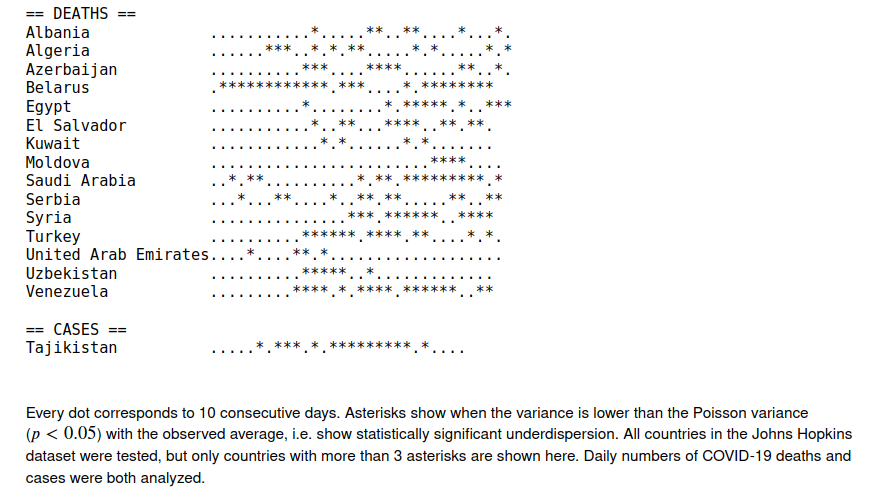
Updated my analysis quantifying underdispersion (relative to Poisson π) in daily reported Covid-19 cases and deaths. Countries listed below have likely been tampering with their data :-/
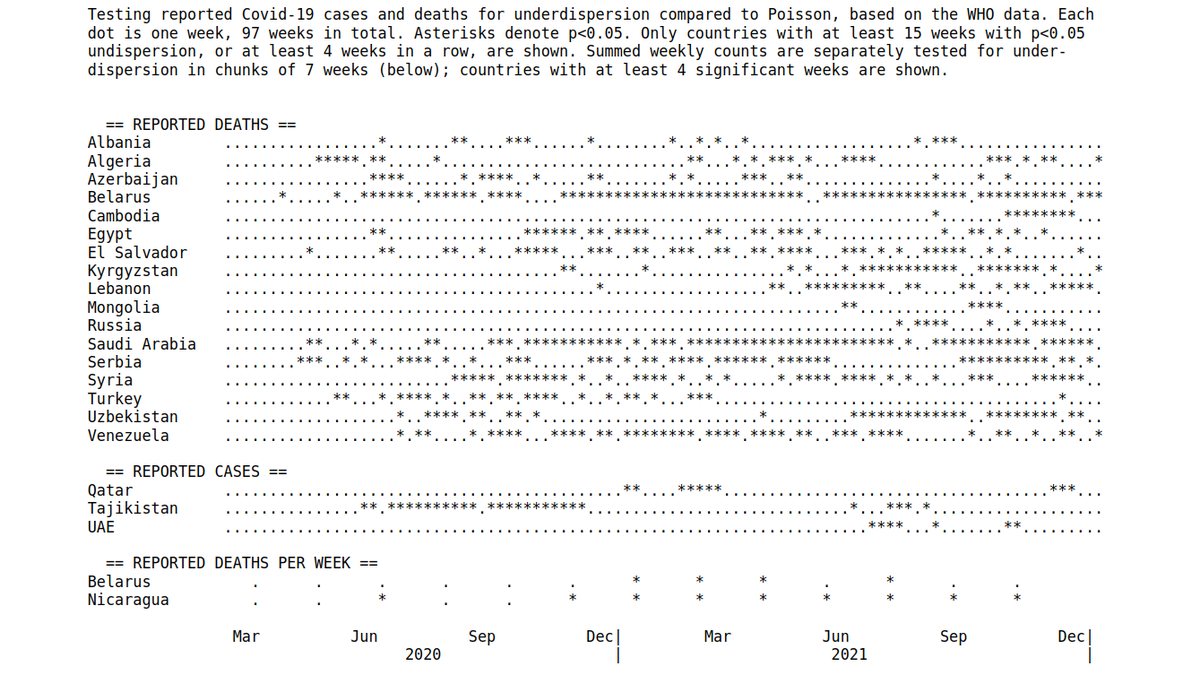
Update: preprint is up. The claim is that Poisson underdispersion in daily reported Covid-19 cases/deaths is a HUGE RED FLAG and suggests misreporting.
Underdispersion ratio (mean/variance) is correlated with undercount ratio based on excess mortality. medrxiv.org/content/10.110β¦
β’ β’ β’
Missing some Tweet in this thread? You can try to
force a refresh
So what's up with the Russian election two weeks ago? Was there fraud?
Of course there was fraud. Widespread ballot stuffing was videotaped etc., but we can also prove fraud using statistics.
See these *integer peaks* in the histograms of the polling station results? π΅οΈββοΈ [1/n]
These peaks are formed by polling stations that report integer turnout percentage or United Russia percentage. E.g. 1492 ballots cast at a station with 1755 registered voters. 1492/1755 = 85.0%. Important: 1492 is not a suspicious number! It's 85.0% which is suspicious. [2/n]
We can use binomial Monte Carlo simulation to find how many polling stations with integer percentages there should be by chance. Then we can compute the number of EXCESS integer polling stations (roughly the summed heights of all INTEGER PEAKS).
Chari et al. (@lpachter) have updated their preprint and doubled down on their claim that an π-looking embedding, a random (!) embedding, and 2D PCA, all preserve data structure "similar or better" than t-SNE.
They literally say: "Picasso can quantitatively represent [local and global properties] similarly to, or better, than the respective t-SNE/UMAP embeddings".
In my thread below I argued it's a non-sequitur from Fig 2, due to insufficient metrics. [2/n]
I argued that they should also consider metrics like kNN recall or kNN classification accuracy, where t-SNE would fare much better than these other methods.
I thought it should be obvious from this figure (using MNIST). But now @lpachter says it's a "mirage".
I am late to the party (was on holidays), but have now read @lpachter's "Specious Art" paper as well as ~300 quote tweets/threads, played with the code, and can add my two cents.
Spoiler: I disagree with their conclusions. Some claims re t-SNE/UMAP are misleading. Thread. π
The paper has several parts and I have too many comments for a twitter thread, so here I will only focus on the core of the authors' argument against t-SNE/UMAP, namely Figures 2 and 3. We can discuss the rest some other time. [2/n]
In this part, Chari et al. claim that:
* t-SNE/UMAP preserve global and local structure very poorly;
* Purposefully silly embedding that looks like an elephant performs as well or even better;
* Even *untrained* neural network performs around as well.
PHATE finds the same 4/7/9 and 8/5/3 mega-clusters that are also emphasized by UMAP, but fails to separate some of the digits within mega-clusters, e.g. green & red (3 and 5) overlap a lot.
IMHO that's a clearly worse performance than t-SNE or UMAP. [2/7]
Of course PHATE was designed for continuous data and that's where it's supposed to shine. But the original paper and tweets like this one and the one above make it look as if it hands-down outperforms t-SNE/UMAP for clustered data.
In a new paper with @JanLause & @CellTypist we argue that the best approach for normalization of UMI counts is *analytic Pearson residuals*, using NB model with an offset term for seq depth. + We analyze related 2019 papers by @satijalab and @rafalab. /1
1) Why does smoothed Ξ²_0 grow linearly? 2) Why is smoothed Ξ²_1 β 2.3?? 3) Why does smoothed ΞΈ grow too??? /2
The original paper does not answer any of that.
Jan figured out that: (1) is trivially true when assuming UMI ~ NB(p_gene * n_cell); (2) simply follows from HS2019 parametrization & the magic constant is 2.3=ln(10); (3) is due to bias in estimation of overdispersion param ΞΈ! /3
The input here is a 1,000,000 x 78,628 matrix X with X_ij = 1 if integer i is divisible by the j'th prime number, and 0 otherwise. So columns correspond to 2, 3, 5, 7, 11, etc. The matrix is large but very sparse: only 0.0036% of entries are 1s. We'll use cosine similarity. [3/n]