Chari et al. (@lpachter) have updated their preprint and doubled down on their claim that an 🐘-looking embedding, a random (!) embedding, and 2D PCA, all preserve data structure "similar or better" than t-SNE.
I still think this claim is absurd. [1/n]
I still think this claim is absurd. [1/n]
https://twitter.com/lpachter/status/1440695021502545934
They literally say: "Picasso can quantitatively represent [local and global properties] similarly to, or better, than the respective t-SNE/UMAP embeddings".
In my thread below I argued it's a non-sequitur from Fig 2, due to insufficient metrics. [2/n]
In my thread below I argued it's a non-sequitur from Fig 2, due to insufficient metrics. [2/n]
https://twitter.com/hippopedoid/status/1437421945956470785
I argued that they should also consider metrics like kNN recall or kNN classification accuracy, where t-SNE would fare much better than these other methods.
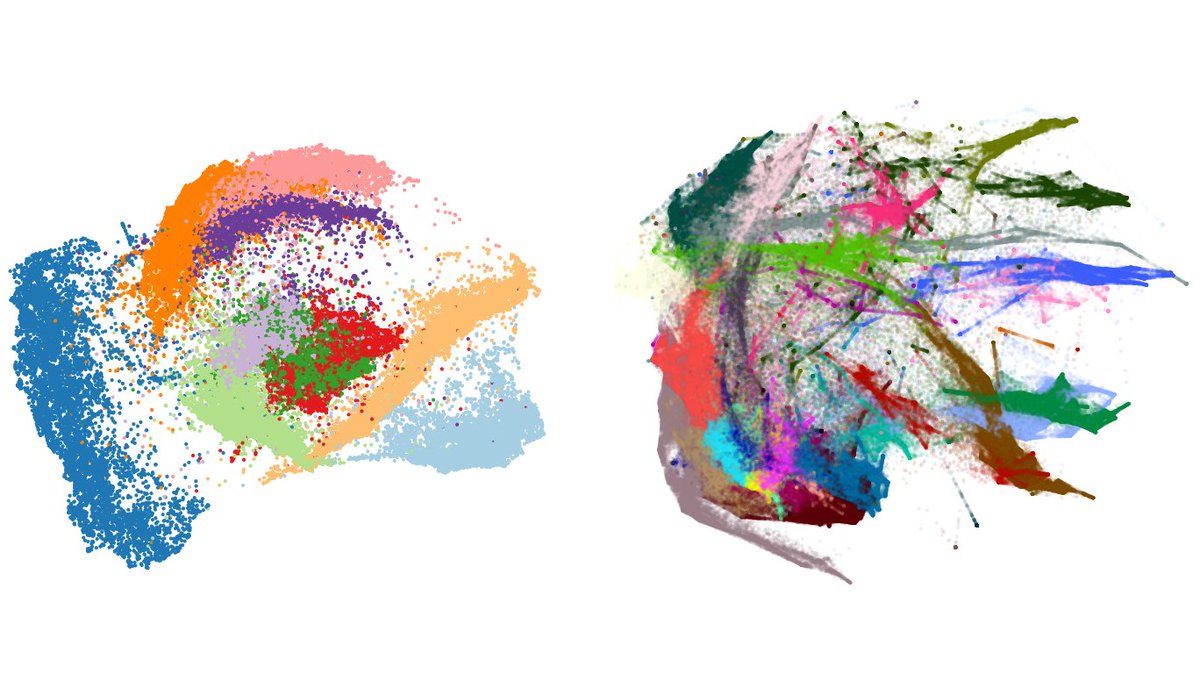
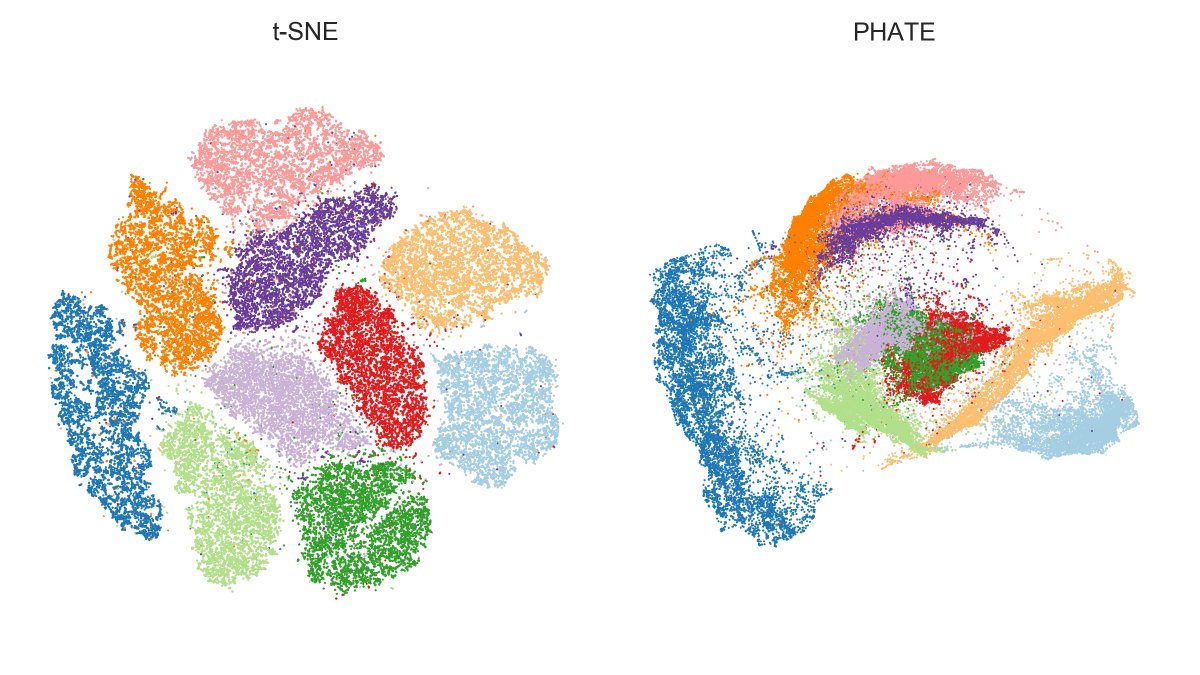
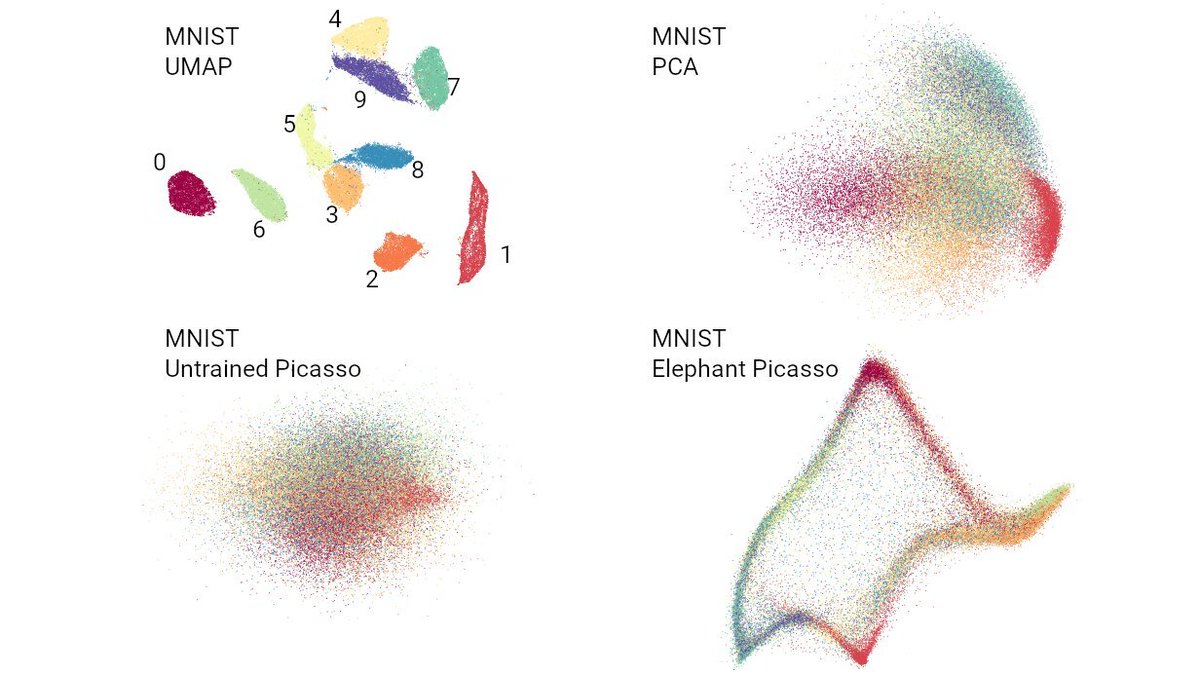
I thought it should be obvious from this figure (using MNIST). But now @lpachter says it's a "mirage".
Is it? [3/n]
I thought it should be obvious from this figure (using MNIST). But now @lpachter says it's a "mirage".
Is it? [3/n]
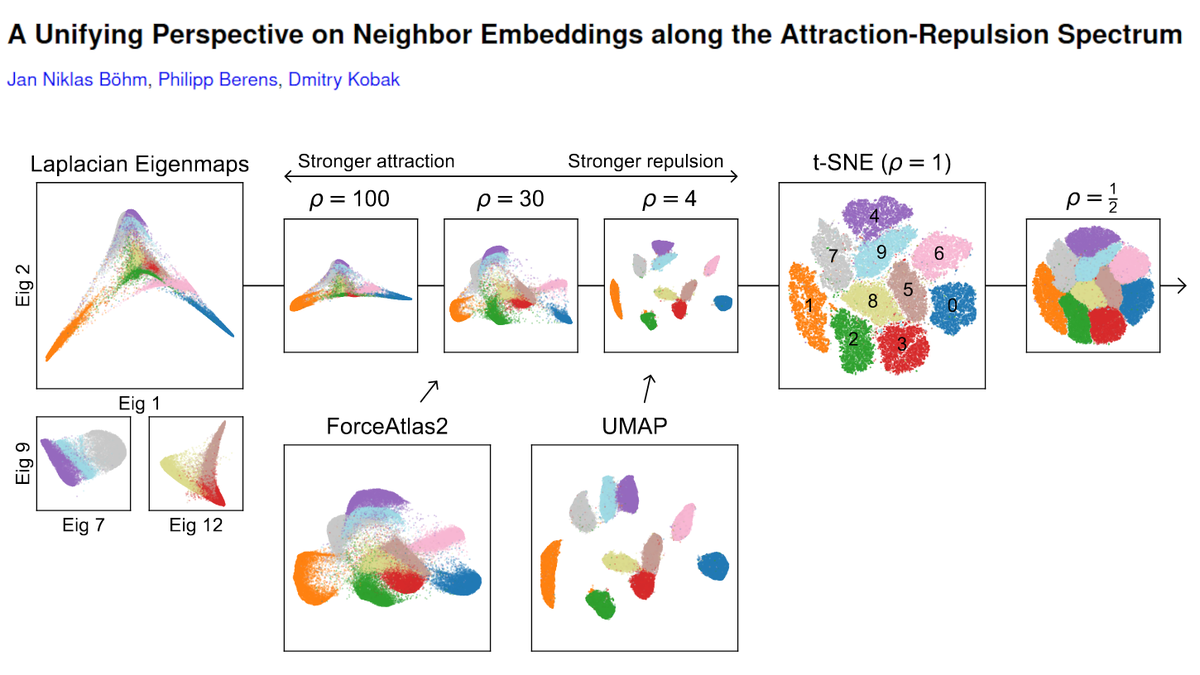
The kNN recall (k=15) of default t-SNE (openTSNE) on MNIST is 36% (interestingly, for UMAP it's much worse; see our preprint with @jnboehm & @CellTypist, arxiv.org/abs/2007.08902).
Lior says 36% is bad. I actually think it's quite good.
But the point is, for PCA it's 1%! [4/n]
Lior says 36% is bad. I actually think it's quite good.
But the point is, for PCA it's 1%! [4/n]
That's not just a bit worse. It's thirty-six times worse! [5/n]
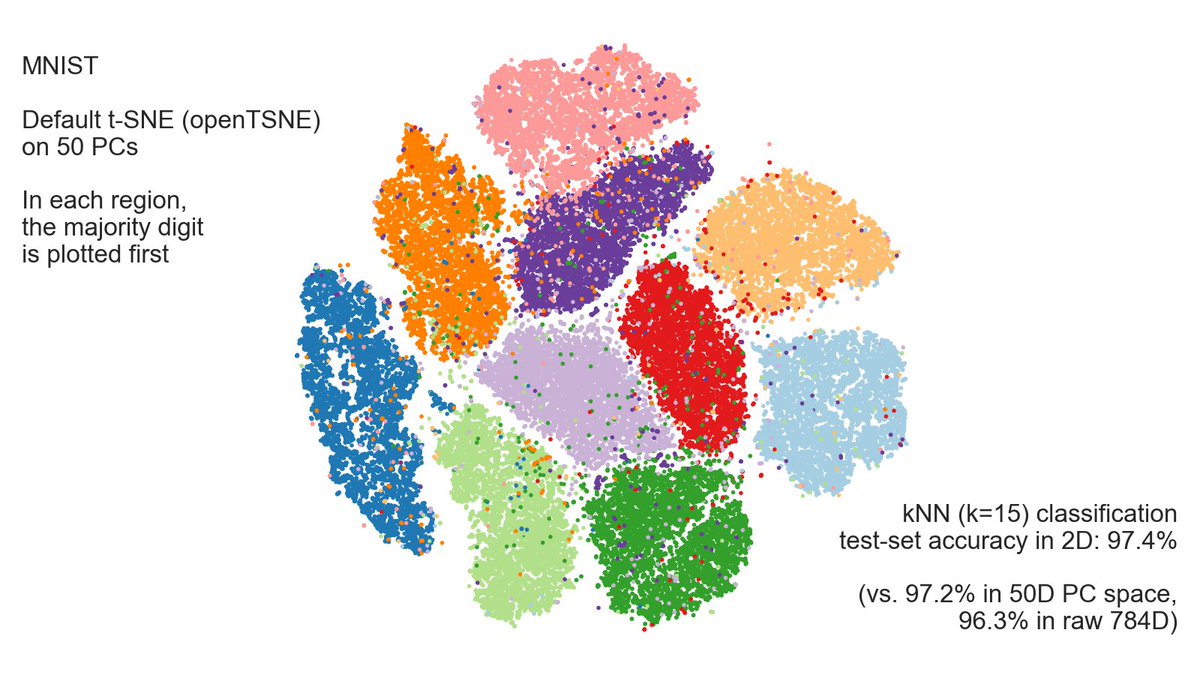
Lior says t-SNE of MNIST looks pleasing but it's an "illusion" due to overplotting. No, it's not an illusion! kNN (k=15) test-set classification accuracy is 97.4%.
kNN accuracy in 50D PCA is 97.2% and in raw 784D it's 96.3%.
So t-SNE **wins** over raw pixels and 50D PCA. [6/n]
kNN accuracy in 50D PCA is 97.2% and in raw 784D it's 96.3%.
So t-SNE **wins** over raw pixels and 50D PCA. [6/n]
But look, there are mis-positioned points, says Lior.
Yes there are. And if one looks at them, one can see that these are screwed-up digits. Here are some examples that t-SNE places into island of "1s". In pixel space, these are indeed close to 1s.
So not t-SNE's fault. [7/n]
Yes there are. And if one looks at them, one can see that these are screwed-up digits. Here are some examples that t-SNE places into island of "1s". In pixel space, these are indeed close to 1s.
So not t-SNE's fault. [7/n]

Incidentally, this shows the power of exploratory analysis and t-SNE as a visual aid. Namely, we have just discovered something interesting about the data: there are 4s and 7s in there that look like 1s! Neat, isn't?
It's just one example of where t-SNE is actually useful. [8/n]
It's just one example of where t-SNE is actually useful. [8/n]
By the way, that MNIST figure in Lior's thread (Suppl Fig 11) is done using @scikit_learn implementation. It's slow and has bad default parameters (will be fixed in sklearn 1.0). That's why the embedding looks worse than it should.
Rather use openTSNE by @pavlinpolicar. [9/n]
Rather use openTSNE by @pavlinpolicar. [9/n]
In conclusion, my practical suggestion to @lpachter is simple: add kNN recall and kNN accuracy to Figure 2, there is enough empty space there for two more metrics.
Then everybody will be able to see and judge how t-SNE is worse than PCA/Picasso and how it's better. [10/n]
Then everybody will be able to see and judge how t-SNE is worse than PCA/Picasso and how it's better. [10/n]
Otherwise it will look like you have cleverly cherry-picked two metrics to prove your point. [11/n]
PS. Nice to see that the Mayer et al. paper on fitting the elephant is now cited! You are welcome. [12/12]
• • •
Missing some Tweet in this thread? You can try to
force a refresh