Appears Cowen published a useful courtesy $SGMO rept for investors prior to their annual HC conference. Most of the verbiage is an accumulation of prior reports. They have higher model royalties for $PFE and $SNY royalties than mine. Not a SOTP or full blown model
Cowen states that though the prelim data on $SNY collab was unimpressive, they are cautiously optimistic. My fcst was pushed out several years consistent with $BLUE issues and probability that more issues will crop up for $CRSP and $SGMO programs.
Attached screenshot of Cowen P&L is consistent with reported $SGMO revenue in C19 including:
- Research reimbursement $16m (mostly Gilead/Sanofi)
- Upfront amort $46m
- Milestones $39m
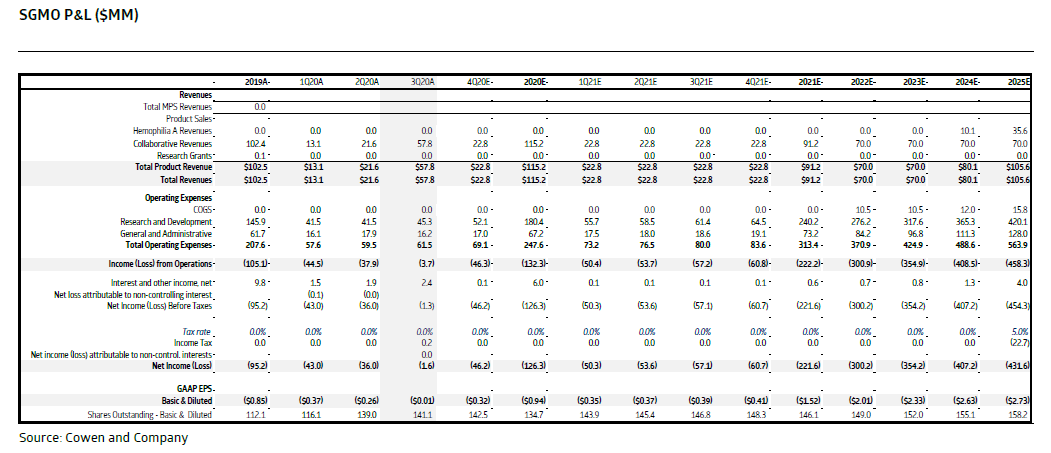
Cowen: See the 2Q20 $SGMO revenue of $21.6m. This includes upfront & research reim rec'd that Q. 3Q increased due to the milestone earned but 4Q returns to the 2Q level which is used for all of C21. Conclusion: This model excludes any milestones or $BIIB $NVS collab increases
• • •
Missing some Tweet in this thread? You can try to
force a refresh
$ARKG Tweet series
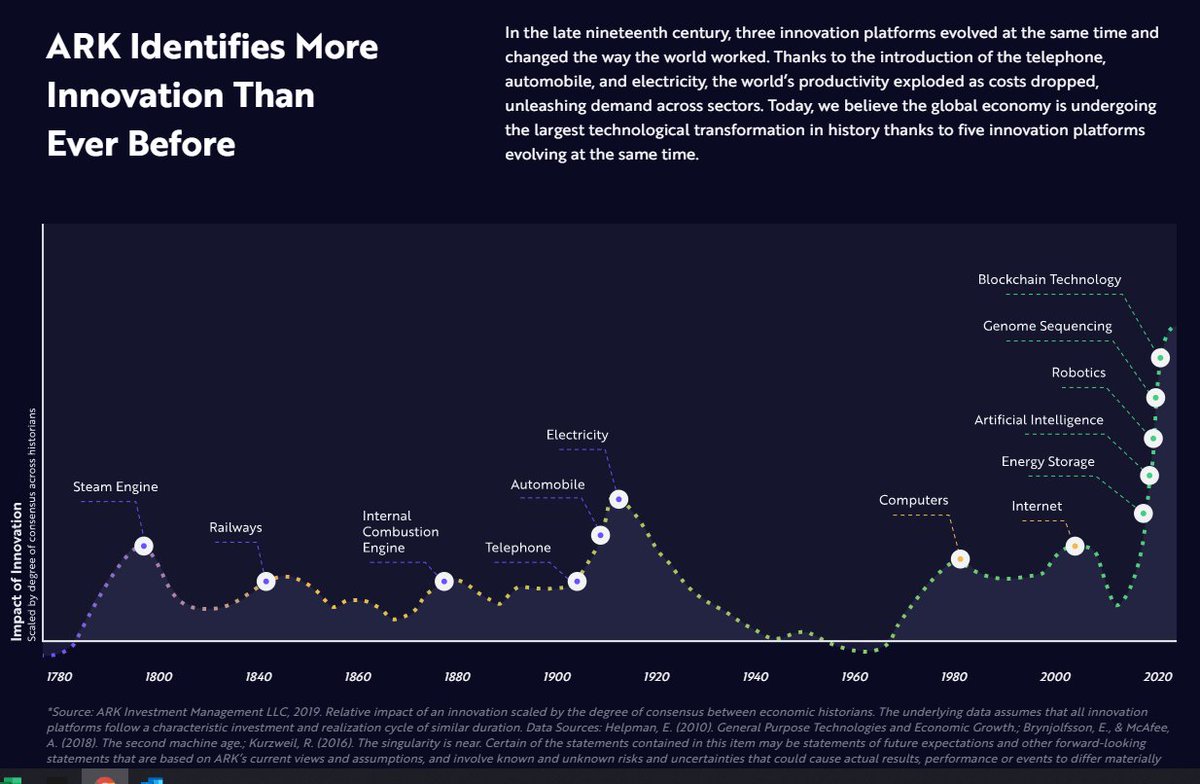
This series of tweets is my opinion only. Cathie Wood has created a group of ETFs that target the disruptive innovation that is both happening and accelerating. These funds have had stellar performance based upon innovation trends and economic theory. 1/
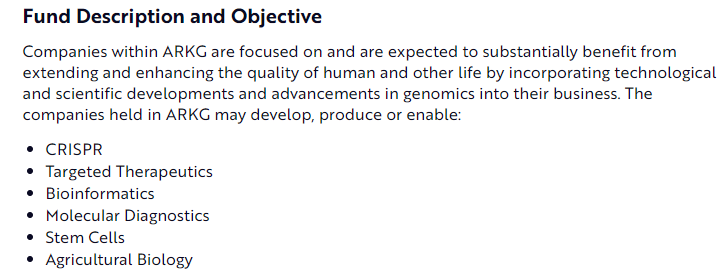
The $ARKG fund description is a good place to start. This has changed recently to a #CRISPR theme but started more with the sequencing cost declines which would drive diagnostics adoption and precision medicine 2/
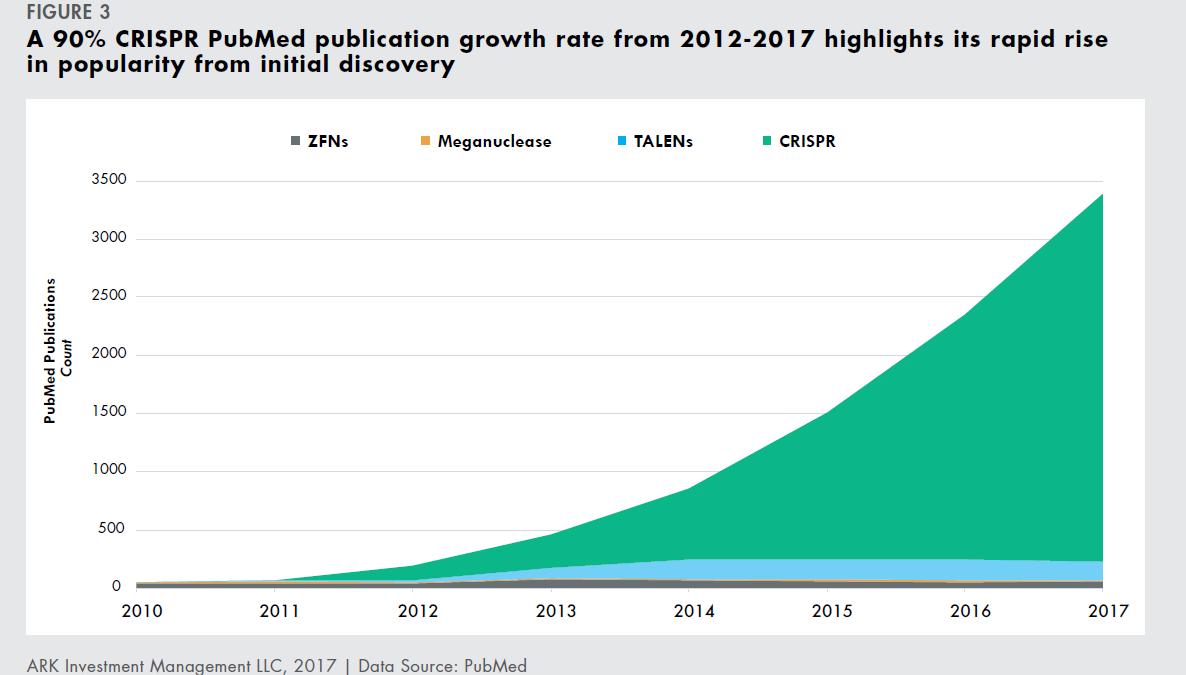
The economic driver of the Genomic Revolution is a multiplier. Not only sequencing cost declines but the impact of moving from #ZFN to #TALENs to #CRISPR is key. As the editing cost has dropped CRISPR is seeing a dominant increase in publications. 3/
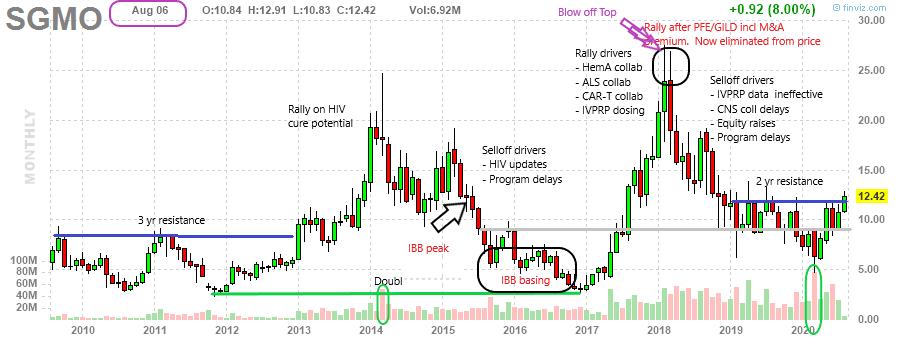
What's up with $SGMO valuation? This thread will try to show some history and the setup for what I still hope to be an outsized move. First worth noting that news will always trump technicals. First here is a month chart I've been using for the company 1/
This being a 10 year chart, it doesn't show how long $SGMO has been around but it does show virtually no trading volume and a 3 yr ceiling on the price as they were in early development stage while trying to get ill-chosen indications into pre/clinic 2/
The first wave $SGMO rally started in 2013 when the ceiling was broken. The company was talking up #GeneEditing#GeneRegulation#HIVcure and #diabetes None were ready but the volume picked up and the first big rally ensued going from around $9 to $20 3/