Ben Sigelman Profile picture
23 Feb, 17 tweets, 5 min read
0/ If you or someone you love uses Kafka in production, I’m sure there’s been some emotional toil when a single producer floods a topic and creates a cascading failure.

This is a 🧵 about how monitoring and observability can make that far less painful.

👇
1/ At a certain level, Kafka is just like any other resource in your system: e.g., your database’s CPUs, your NICs, or your RAM reservations.

All resources are finite, and when they participate in transactions, there is a little bit less of them than when they don’t.
2/ The reason that Kafka failures are so spectacular isn’t all Kafka’s fault: it’s just that it takes on a role nearly as essential as the network itself, and so when it breaks it can take your app with it. New failure modes get discovered the hard way, and everybody loses. 📉
3/ (Side note: I remember networking failures being much more of “a thing” in the early 2000s than they are today – in terms of reliability scar tissue, maybe Kafka really *is* the new network?)
4/ In any case, when Kafka gets overloaded, the immediate question on everyone’s mind is actually the central question of observability: “what caused that change?”

(Side note: More on that subject here → )
5/ This is hard, though, as “the change” we’re investigating here is in these rather opaque Kafka lag metrics, but “the cause “ (or at least the main contributing factor) has to do with *the workload*: i.e., some actual shift in the *usage* of Kafka.
6/ What I’m going to show next is part of @LightstepHQ’s product, but this isn’t meant as a pitch as much as it’s meant as a way to make all of this more concrete.

Along those lines, let’s start with a *real* Kafka issue from our own SaaS as an example:
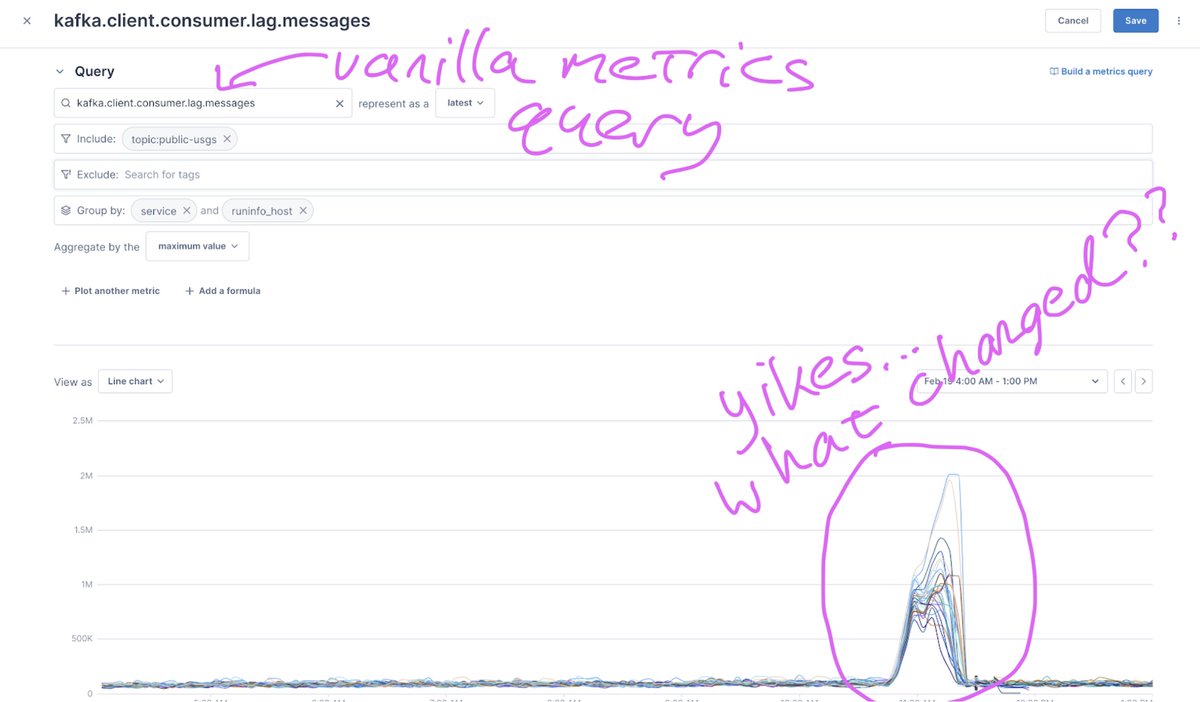
7/ To set context, this chart is from a completely “boring” metrics query in Lightstep’s own self-hosted meta-monitoring. We’re taking Kafka consumer lag, filtering by a specific Kafka topic of interest, doing a group-by, and visualizing the results.
8/ These results are also mostly “boring” – except for the one period of about 45 minutes where they were unfortunately extremely not-boring!

Yikes – and again, “what changed?”
9/ IMO this is the point at which normal/conventional monitoring tools fail us.

The by-far most important question (about change) is, in fact, *basically un-answerable* within any siloed metrics product.

But what if you could just click on the anomaly?
10/ So, here we *can* just click on the anomaly, even in a plain-old metrics chart like this one. I.e., the Kafka anomaly itself becomes *actionable*, and we can bridge directly to a guided analysis of the Kafka *workload*.
11/ Having clicked on that “what changed?” button, we’re taken to a dedicated “change intelligence” UX. Above the fold we see the metric in question – the Kafka consumer lag – with both the deviation (where we clicked) and an automated baseline pre-selected for us:
12/ And then with literally no other typing or user input – nor any special configuration in the system itself – true change-oriented observability can *show us how the Kafka workload shifted during the deviation*, like this:
13/ What we’re seeing here is *a single customer* within suddenly jumping from 0.86% of the workload to 15.95% of the workload.

And that’s why the message lag increased. We have *just* started investigating and already have our smoking gun – and a high-cardinality one to boot!
14/ With conventional tooling, diagnosing Kafka resource contention is extremely challenging, particularly when it’s due to a workload change like in this real-world example.

But here it’s not so daunting, even days after the fact.
15/ And if we want to know *what* those single-customer transactions were doing, we can just look:
16/ So that’s it. Kafka is useful and valuable, but it’s invariably a shared dependency and can fail in spectacular ways – with modern observability, at least we have a clean shot at understanding why, and quickly.

• • •

Missing some Tweet in this thread? You can try to force a refresh
 

Keep Current with Ben Sigelman

Ben Sigelman Profile picture

Stay in touch and get notified when new unrolls are available from this author!

Read all threads

This Thread may be Removed Anytime!

PDF

Twitter may remove this content at anytime! Save it as PDF for later use!

Try unrolling a thread yourself!

how to unroll video
  1. Follow @ThreadReaderApp to mention us!

  2. From a Twitter thread mention us with a keyword "unroll"
@threadreaderapp unroll

Practice here first or read more on our help page!

More from @el_bhs

12 Feb
0/ When large eng orgs rely on metrics for both monitoring *and* observability, they struggle with cardinality.

This is a thread about “the two drivers of cardinality.” And which one of those we should kill. :)

🧵👇
1/ Okay, first off: “what is cardinality, anyway?” And why is it such a big deal for metrics?

“Cardinality” is a mathematical term: it’s *the number of elements in a set*... boring! So why tf does anybody care??

Well, because people think they need it, then suddenly, "$$$$$$$."
2/ When a developer inserts a (custom) metric to their code, they might think they’re just adding, well, *one metric*. …
Read 16 tweets
5 Feb
0/ This is a 🧵about my experiences building both the Distributed Tracing and Metrics infra at Google.

And, particularly, my regrets. :)

Here goes: 👇 Image
1/ Dapper certainly did some fancy tricks, and I’m sure it still does. If it’s possible to fall in love with an idea or a piece of technology, that’s what happened with me and Dapper. It wasn’t just new data, it was a new *type* of data – and lots of it. So. Much. Fun. …
2/ … And yet: early on, *hardly anybody actually used it.*

Dapper was certainly _valuable_ (we saved GOOG untold $10Ms in latency improvements alone) but not “day-to-day essential.” Why?
Read 13 tweets
13 Jan
0/ I’m tired of hearing about observability replacing monitoring. It’s not going to, and that’s because it shouldn’t.

Observability will not _replace_ monitoring, it will _augment_ monitoring.

Here’s a thread about observability, and how monitoring can evolve to fit in: 👇 Image
1/ Let’s start with the diagram (above) illustrating the anatomy of observability. There are three layers:

I. (Open)Telemetry: acquire high-quality data with minimal effort
II. Storage: “Stats over time” and “Transactions over time”
III. Benefits: *solve actual problems*
2/ The direction for “Telemetry” is simple: @opentelemetry.

(This is the (only) place where the so-called "three pillars” come in, by the way. If you think you’ve solved the observability problem by collecting traces, metrics, and logs, you’re about to be disappointed. :-/ ) Image
Read 12 tweets
16 Jun 20
0/ This is a thread about *Logging* and how – for decades – it’s been a needlessly “selfish” technology.

And how that should change.

I promise this eventually gets concrete and involves real examples from production. :)

👇
1/ First off, a crucial clarification: I don’t mean that the “loggers” – that is, the human operators – are selfish, of course! The problem has been that their (IMO primitive) toolchain needlessly localizes and *constrains* the value of the logging telemetry data.
2/ How? Well, traditional logging tech encourages the code-owner to add logs *in order to explain what’s happening with their code, in production, to themself.* Or, maybe, to other/future owners of that particular patch of code.

Useful? Sometimes. But both limited and limiting.
Read 15 tweets
8 Jun 20
0/ Sometimes we should philosophize about observability… and sometimes we should just get ultra-pragmatic and examine real use cases from real systems!

Here is one about a bad deploy we had at @LightstepHQ the other day. Let’s get started with a picture…

Thread 👇
1/ In this example, we are contending with a failed deploy within Lightstep’s own (internal, multi-tenant) system. It was easy enough to *detect* the regression and roll back, but in order to fix the underlying issue, of course we had to understand it.
2/ We knew the failure was related to a bad deploy of the `liveview` service. The screenshot above shows `liveview` endpoints, ranked by the “biggest change” for the new release; at the top is “ExplorerService/Create” with a huge (!!) increase in error ratio.
Read 13 tweets
17 Apr 20
0/ Now that organizations are building or buying observability, they are realizing that it can get really damned expensive. And not just “expensive,” but “expensive and out of control.”

This is a thread about *observability value:* both the benefits and the costs.
1/ You hear so much about observability because it *can* be awesome. :) Benefits roll up into at least one of the following:

- Reducing latencies or error rates (foreach service)
- Reducing MTTR (also foreach service)
- Improving velocity or communication (foreach team)
2/ But most observability vendors charge based on something that has literally no value on its own: *the telemetry.*

This is rough for customers, especially since these vendors provide no mechanism to scale or *control* the telemetry volume (why would they? it’s $$$!).
Read 16 tweets

Did Thread Reader help you today?

Support us! We are indie developers!


This site is made by just two indie developers on a laptop doing marketing, support and development! Read more about the story.

Become a Premium Member ($3/month or $30/year) and get exclusive features!

Become Premium

Too expensive? Make a small donation by buying us coffee ($5) or help with server cost ($10)

Donate via Paypal Become our Patreon

Thank you for your support!

Follow Us on Twitter!