Frisch erschienen: Unser neues Paper in Nature Geoscience erhärtet die Belege für eine einzigartige Abschwächung des Golfstromsystem (Atlantische Umwälzströmung, 𝗔𝗠𝗢𝗖) ! @NatureGeosci
Thread. 1/12
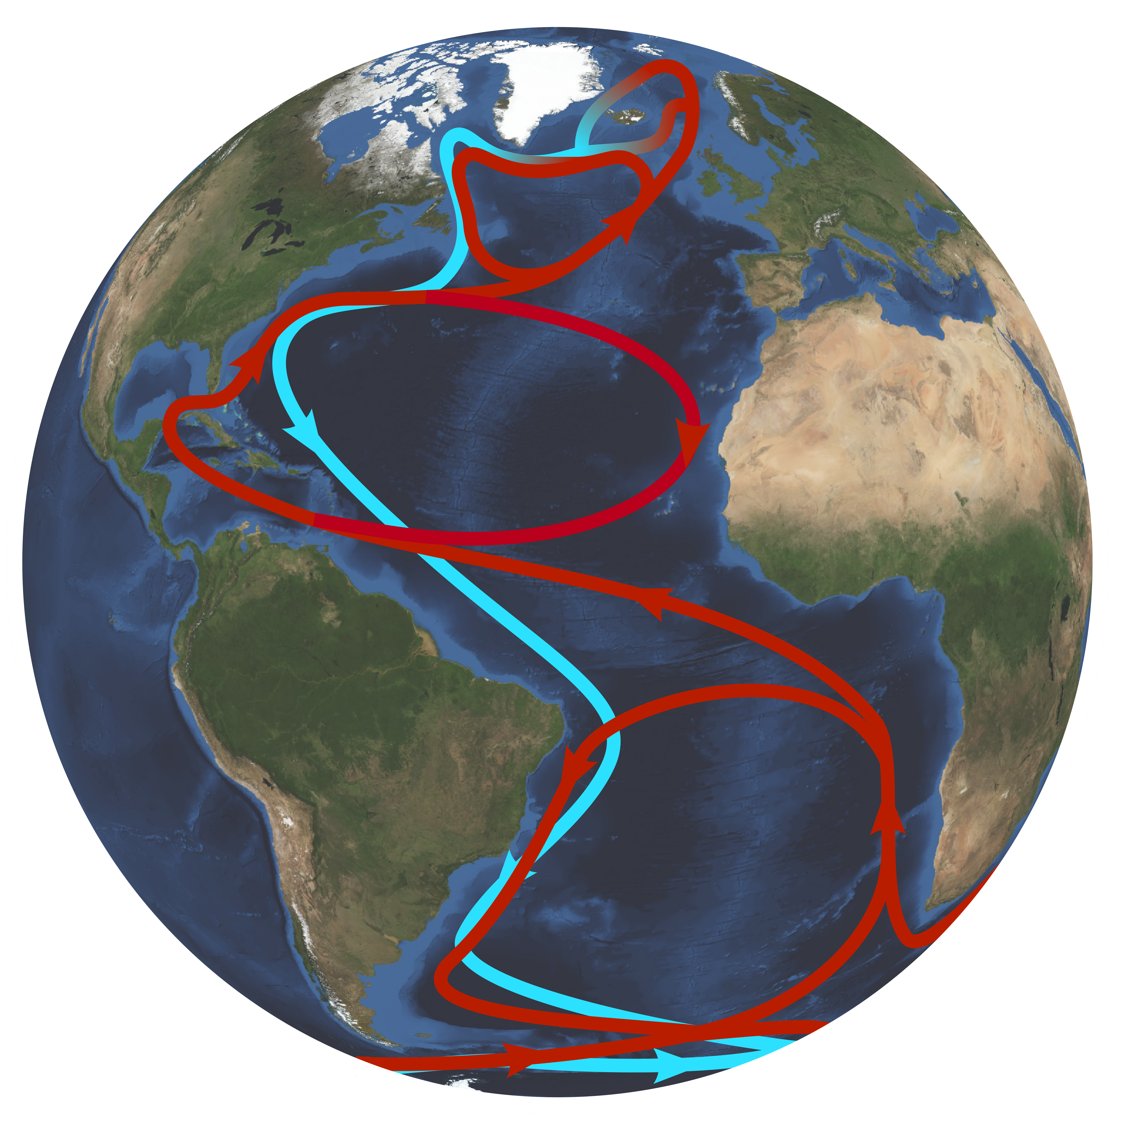
Erstautorin Levke Caesar (Maynooth University) hat eine Reihe von veröffentlichten AMOC Rekonstruktionen aus Proxydaten (v.a. aus Tiefseesedimenten) zusammengestellt, die bis 1600 Jahre zurück reichen. Sie zeigen Strömungsgeschwindigkeit, Wassermassen, Wärmetransport an. 2/12
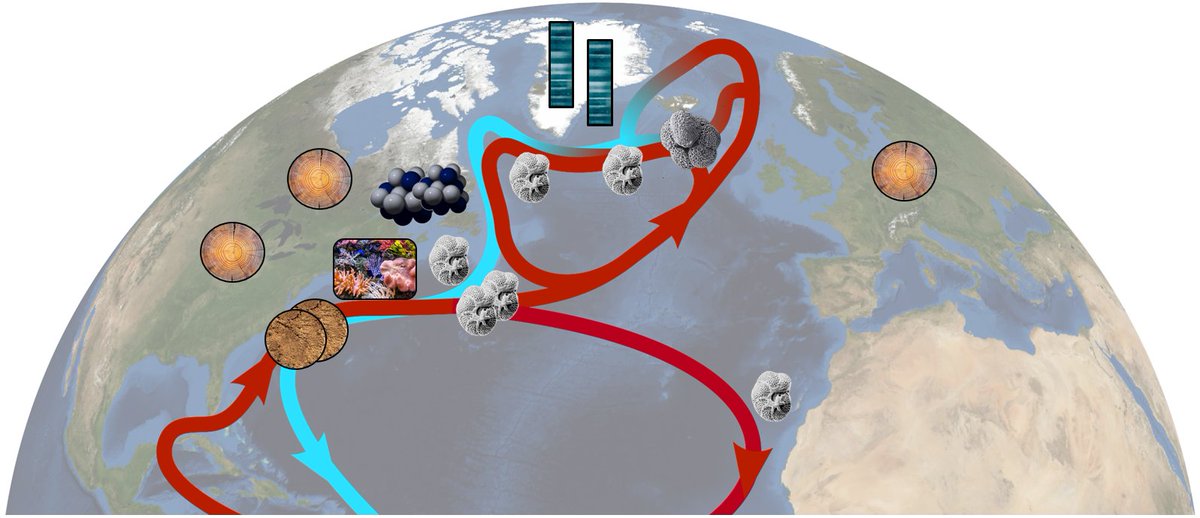
Diese Daten zeigen übereinstimmend eine klare Abschwächung im 20. Jh; in den letzten Jahrzehnten ist die Strömung am schwächsten. In 9 der 11 Datenreihen ist dies statistisch signifikant. 3/12
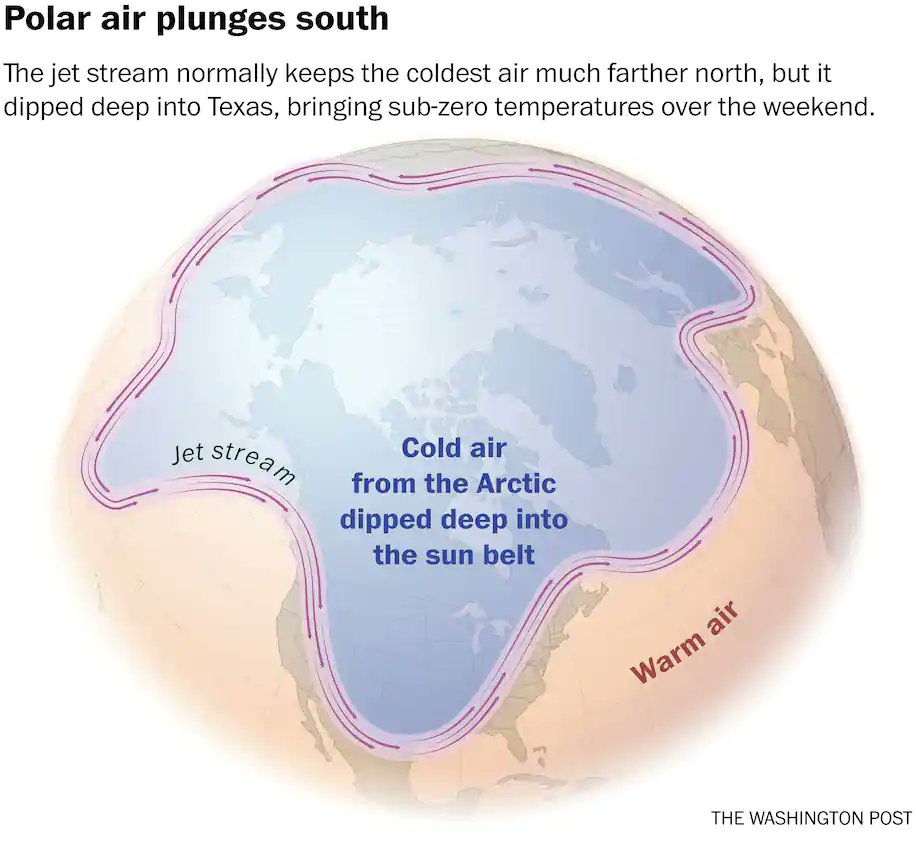
Diese Abschwächung wurde so von Klimamodellen als Folge der #Erderhitzung vorhergesagt und verursacht einen spezifischen Fingerabdruck der Meerestemperaturen, incl. "Kälteblase" im nördlichen Atlantik. Siehe scilogs.spektrum.de/klimalounge/st… 4/12
Was die beiden letzten Berichte des Weltklimarats IPCC zur Abschwächung gesagt haben. Der IPCC ist bekannt konservativ, bin gespannt was der nächste Bericht zu den neuen Belegen sagen wird. 5/12
In diesem Spiegel-Kommentar habe ich im September zwei weitere Studien mit Belegen für eine Abschwächung besprochen. spiegel.de/wissenschaft/m… 6/12
Einige erwähnen zur aktuellen Studie eine weitere, die einen stabilen Golfstrom seit 1990 fand. Das deckt sich mit unserer Rekonstruktion: dem Langzeittrend überlagern sich Schwankungen, 1990 war danach ein Tiefpunkt. Ab 1990 gerechnet sehen wir daher auch keinen Trend. 7/12
Dieses und weitere mögliche Gegenargumente gegen eine anthropogene Abschwächung habe ich hier bereits 2018 diskutiert: realclimate.org/index.php/arch…
Grafik: Darstellung der Kälteblase im Atlantik (Trend der Lufttemperaturen) aus dem 5. IPCC-Bericht. 8/12
Wie viel Abschwächung der AMOC sagen die neuesten Klimamodelle (CMIP6) bis 2100 voraus? Zitat: "the AMOC might decline between 6 and 8 Sv (34–45%) by 2100." Das könnte uns gefährlich nahe an den Kipppunkt bringen. agupubs.onlinelibrary.wiley.com/doi/full/10.10… 9/12
Mehr zum Risiko, den Kipppunkt zu überschreiten, habe ich hier geschrieben: scilogs.spektrum.de/klimalounge/di… 10/12
Zu guter Letzt: ein kurzer Ausschnitt aus dem Hollywoodfilm The Day After Tomorrow von 2004. Den hatte ich damals hier besprochen: pik-potsdam.de/~stefan/tdat_r… 12/12

• • •

Missing some Tweet in this thread? You can try to force a refresh
 

Keep Current with Stefan Rahmstorf 😷

Stefan Rahmstorf 😷 Profile picture

Stay in touch and get notified when new unrolls are available from this author!

Read all threads

This Thread may be Removed Anytime!

PDF

Twitter may remove this content at anytime! Save it as PDF for later use!

Try unrolling a thread yourself!

how to unroll video
  1. Follow @ThreadReaderApp to mention us!

  2. From a Twitter thread mention us with a keyword "unroll"
@threadreaderapp unroll

Practice here first or read more on our help page!

More from @rahmstorf

25 Feb
Just out: our new paper affirming the unprecedented slowdown of the Gulf Stream System (aka Atlantic meridional overturning circulation, 𝗔𝗠𝗢𝗖) in Nature Geoscience! @NatureGeosci A thread. 1/11
Lead author Levke Caesar compiled a range of different, published proxy data reconstructions of the AMOC - thanks to all their authors for sharing them. The longest ones go back 1600 years! They represent different AMOC facets: flow speed, water masses, heat transport. 2/11
These data consistently show an AMOC decline in the 20th Century, with the weakest AMOC state of the whole series in the last decades. This finding is statistically significant in 9 of the 11 time series. 3/11
Read 13 tweets
17 Feb
Two competing effects influence our northern winters:

#1 Global warming.

#2 Increasing polar air outbreaks due to stratospheric polar vortex disturbances.

In the long run #1 wins - our winters are getting warmer. 1/🧵 Image
That's expected as #2 just happens occasionally, and polar air is also getting warmer.

Some people point to long-term warming trends to cast doubt on whether #2 is even real, but that is a non-sequitur. It just means #1 wins in the long run. 2/🧵 Image
That disturbed stratospheric polar vortex states are linked to polar air outbreaks and thus cold extremes either in Eurasia or the US is shown by data analysis: nature.com/articles/s4161… 3/🧵
Read 9 tweets
27 Oct 20
The US elections are now climate elections, as Trump focuses on discrediting Biden's statement about transitioning from oil to renewable energy. It's the fossil fuel lobby versus sensible climate policy. The 20th Century pitched against the 21st. (1/🧵)
Stopping #GlobalWarming is only possible by getting beyond fossil fuels. All nations on this planet agreed in Paris to stop warming well below 2°C. Most of the fossil fuel resources must remain in the ground for that. 2/🧵
China plans to be climate neutral by 2060. Japan, Canada and the EU by 2050. The world is getting out of coal, oil and gas. Trying to scandalise this while the country burns and is ravaged by storms and rising seas, is about as smart as recommending to drink disinfectant. 3/🧵
Read 4 tweets
15 Sep 20
Und nun die Wettervorhersage für Dienstag, den 15. September...
Es freut mich, dass viele hier auf den Unterschied von Wetter und Klima hinweisen! Aber wussten Sie auch, dass der Klimawandel inzwischen schon im täglichen Wetter nachweisbar ist? ethz.ch/de/news-und-ve…
Wer sich für die langfristige Temperaturentwicklung in 🇩🇪 interessiert:
Read 6 tweets
17 Aug 20
News about the death of the Greenland Ice Sheet is greatly exaggerated. What the new paper shows is an observed increase in solid ice discharge into the ocean, which has been at a higher rate than before during the past 15 years. The authors basically say: if this continues, ...
...then the Greenland Ice Sheet will continue to lose mass.
But due to that, the ice front retreats from the ocean, as nicely shown e.g. in Andy Aschwanden's detailed simulations:
And when the ice loses contact with the ocean, the ice discharge stops.
The tipping point for losing the Greenland Ice Sheet altogether therefore depends on surface melt permanently exceeding snowfall and does not involve solid ice discharge. Whether this real tipping point of Greenland has been crossed, we do not know.
Read 7 tweets
11 Aug 20
Gern, aber was genau ist der Fehler? In ihrem Artikel greifen Sie die Grafik ja nur mit zwei Falschbehauptungen an. @AxelBojanowski 1/🧵
Erstens, sie sei nicht in der Fachliteratur publiziert. Stimmt nicht. Sogar sehr prominent, seit vier Jahren, viel zitiert, und ich habe in der Zeit keine Kritik dazu gehört. Ein Fachjournalist sollte das nicht verpasst haben. 2/🧵
Zweitens, die Grafik zeige jährliche Daten. Stimmt nicht, es sind über 30 Jahre klimatologisch geglättete Daten. Niemand hat behauptet, es sei "bereits wärmer als während aller Jahre seit der Eiszeit". Über einzelne Jahre kann man das gar nicht sagen. 3/🧵
Read 11 tweets

Did Thread Reader help you today?

Support us! We are indie developers!


This site is made by just two indie developers on a laptop doing marketing, support and development! Read more about the story.

Become a Premium Member ($3/month or $30/year) and get exclusive features!

Become Premium

Too expensive? Make a small donation by buying us coffee ($5) or help with server cost ($10)

Donate via Paypal Become our Patreon

Thank you for your support!

Follow Us on Twitter!