we've all heard a lot about super-transmissibility of UK variant. Estimates were based on Volz, Neil Ferguson et al 2021. Here is right panel of their Figure 3 showing "additive advantage" of variant of >60% (horizontal line). medrxiv.org/content/10.110….
2/ Volz, Ferguson et al used data from epidemic weeks 46-49. Generating code for this figure and out of sample data (weeks 50-56) is available for at github.com/mrc-ide/sarsco…. Out of sample, super transmissibility vanishes as variant became dominant.
@BogochIsaac @NathanStall
3/ the UK wave associated with the variant was real enough, but out of sample data counter-indicates the super-transmissibility hypothesis.
4/ Ferguson and colleagues are well aware of this information, but apparently haven't reported it. Here is a graphic from their github showing combined results for weeks 45-54: github.com/mrc-ide/sarsco…
5/ here's a graph showing progress of variant in UK. It has the same sort of Gompertz curve as "original" S-positive COVID. This can be produced without super-transmissibiliyty by "founder effect" in which variant got foothold in new "sub-market" and did what virus does.
6/ the convergence of S-negative (variant) transmission to S-positive (ordinary) transmission is evidence to me that data is better explained by a founder effect phenomenon, and contra super-transmissibility.
7/ one small comment on coding style which gave me bad impression of author competence. Here is a code section in which they calculate elements in a matrix one-by-one in do loops. There's no need to do that as it can be done easily and more transparently in one line.
8/ another point: authors do not provide links to the original original data, which presumably comes from UK public health authorities. I was unable to locate. So I used the Ferguson et al github compilation. It would be better if they archived data as received from public health
9/ on Jan 7, Ferguson article on UK variant reviewed for Public Health Ontario. Reviewer stated that Ferguson article "at this time should not be used to inform policy or decision-making". Nonetheless, article was repeatedly used for policy and decisions publichealthontario.ca/-/media/docume…
10/ on Feb 11, Ontario's COVID science advsory panel, Science Table, covid19-sciencetable.ca/wp-content/upl… projected explosive exponential growth in variant, showing Toronto as example reaching 50% of all cases by Mar 1, with full third wave by mid-March. This Triggered enhanced lockdown.
11/ What happened? As usual, scare projections didn't materialize. Total cases continued declining at same rate. Variant has thus far been negligible. Less than 3 weeks from projection, Toronto is at 50% of Feb 11 projections (with earlier projections even further off.)
12/ in next projections (Feb 25 covid19-sciencetable.ca/wp-content/upl…), Science Table continued to project alarm over variant but delaying prediction somewhat: on Feb 11, predicted variant at 50% by Mar 1; on Feb 25, predicted 40% by second week.
13/ so how close are variants to reaching 40%? Between Feb 15 and Feb 28, there were 226 (535-309) new cases of B.1.1.7 (UK) variant. In the same period, there were 15007 (301839-286832) total new cases. About 1.5%.

• • •

Missing some Tweet in this thread? You can try to force a refresh
 

Keep Current with Stephen McIntyre

Stephen McIntyre Profile picture

Stay in touch and get notified when new unrolls are available from this author!

Read all threads

This Thread may be Removed Anytime!

PDF

Twitter may remove this content at anytime! Save it as PDF for later use!

Try unrolling a thread yourself!

how to unroll video
  1. Follow @ThreadReaderApp to mention us!

  2. From a Twitter thread mention us with a keyword "unroll"
@threadreaderapp unroll

Practice here first or read more on our help page!

More from @ClimateAudit

26 Feb
the burden of COVID lockdown has been borne entirely by local small businesses and their employees - a gross inequity ignored by public health ethicists, who haven't lost a single fat paycheck. The devastation is visible on store fronts in arterial road (Danforth) near me,
2/ here are pictures of 10 shuttered premises in short two blocks, each representing the end of someone's dream and livelihood, with each owner ending up with losses and debts.
3/ two more
Read 8 tweets
26 Feb
this is such garbage reporting by US media: what US calls "Iranian-backed militia" are units of Iraqi military. Iraq is majority Shia so there are Shia units in Iraq military. Hard to see how bombing Iraqi military units is going to improve US-Iraq relations.
Iraq asked US to withdraw forces from Iraq as they are not currently fighting ISIS. US military in Iraq has become hostile occupying force that has no strategic purpose, is a target for local resistance, creating pointless risk of larger conflict to "honor" their sacrifice.
an astounding replay of events of Dec 29, 2019. Biden admin says that there was a rocket attack near Irbil in Kurdish area in northeastern Iraq. The Dec 2019 rocket attack was in nearby Kirkuk, also in Kurdish area, where ISIS cells were also active, making attribution obscure
Read 9 tweets
23 Feb
Neil Ferguson, notorious lead author of Imperial College model, sent a snarky and supercilious response to an earnest but questioning citizen concerned about policy. Full significance of Ferguson's reply wasn't appreciated by recipient but will be understood by old CA readers.
2/ Ferguson's go-to reference for someone daring to question his statistical work was the following: climatechangecommunication.org/wp-content/upl…. Guess what it was. Without peeking.
3/ COVID modeler Neil Ferguson's go-to reference was Lewandowsky and Cook, 2020. The Conspiracy Theory Handbook.
Read 17 tweets
15 Feb
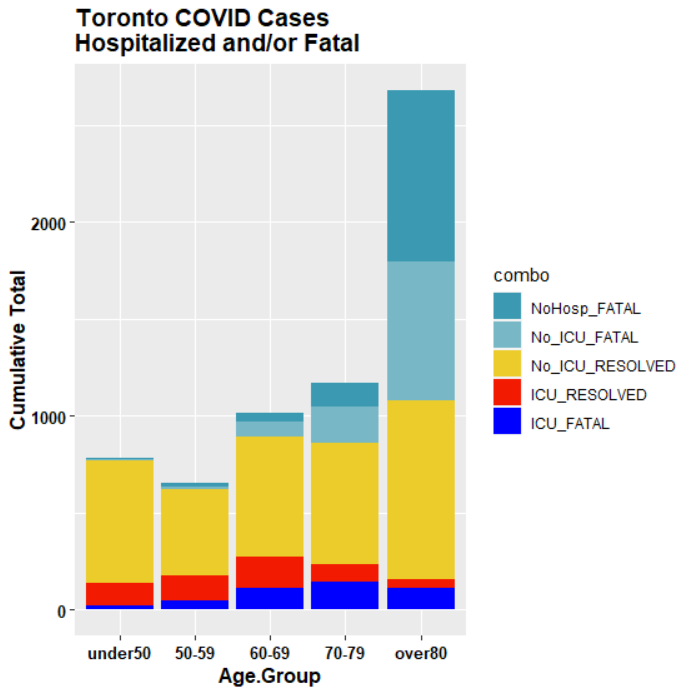
primary concerns re COVID are: fatalities, ICU &hospitalization, which vary by age group. Not easy finding data granular enough to examine interactions. Nor are such details discussed collectively (as they should) in Ontario science briefings. Here is (hard-won) Toronto summary.
while COVID impact on ICUs has been a (if not the) primary focus of "Science Table" briefings, the number of fatalities is about 2.5 times higher than number of people who've gone to ICU. Mostly people over 80 who've died in community or in non-ICU hospital wards.
fatality rates of over 80s (and over 70s) in ICUs is very high: 70% (61%) respectively, while recovery rate of under 50s is very high (86%).
Read 12 tweets
11 Feb
the oh-so-woke Ontario Science Table presented graphs purporting to show share of LTC of total deaths (left) and ICU (right). According to these figures, LTC accounts for substantial majority of deaths (~70%) but micro-fraction of ICU admissions. Has this been observed elsewhere?
2/ on its face, this figure contradicts a claim that I've been making: that vaccinating vulnerable in LTC would be effective means of mitigating concerns over projected ICU overcrowding. But is figure correct?
3/ if figure is correct, this seems like pretty fundamental information for policy-makers. So why havent Ontario science advisors ever mentioned it previously?
Read 4 tweets
11 Feb
on Jan 21, 2021, just as vaccine supply in Canada dried up, Science Table, Ontario's woke COVID advisors, belatedly urged that govt to accelerate vaccination of LTC residents (relative to young HCWs outside LTC residences). Exactly what I'd urged on Dec 22
covid19-sciencetable.ca/sciencebrief/t…
2/ even this belated recognition by woke Science Table omitted the main reason why vulnerable 80+s, especially LTC 80"s, deserved priority even ahead of young HCWs: its direct impact on hospitalizations given expected pending hospital crisis
3/ I said this not to disparage contribution of young doctors, HCWs in ICUs. My father was a surgeon, two nieces are doctors. My family has benefited greatly from prompt and inspired care in Toronto ICUs. My point was policy: vaccinating seniors was best way to avert ICU crisis
Read 5 tweets

Did Thread Reader help you today?

Support us! We are indie developers!


This site is made by just two indie developers on a laptop doing marketing, support and development! Read more about the story.

Become a Premium Member ($3/month or $30/year) and get exclusive features!

Become Premium

Too expensive? Make a small donation by buying us coffee ($5) or help with server cost ($10)

Donate via Paypal Become our Patreon

Thank you for your support!

Follow Us on Twitter!