*refresh*
*refresh*
*refresh*
Did AHS write the code the AB Parks too?
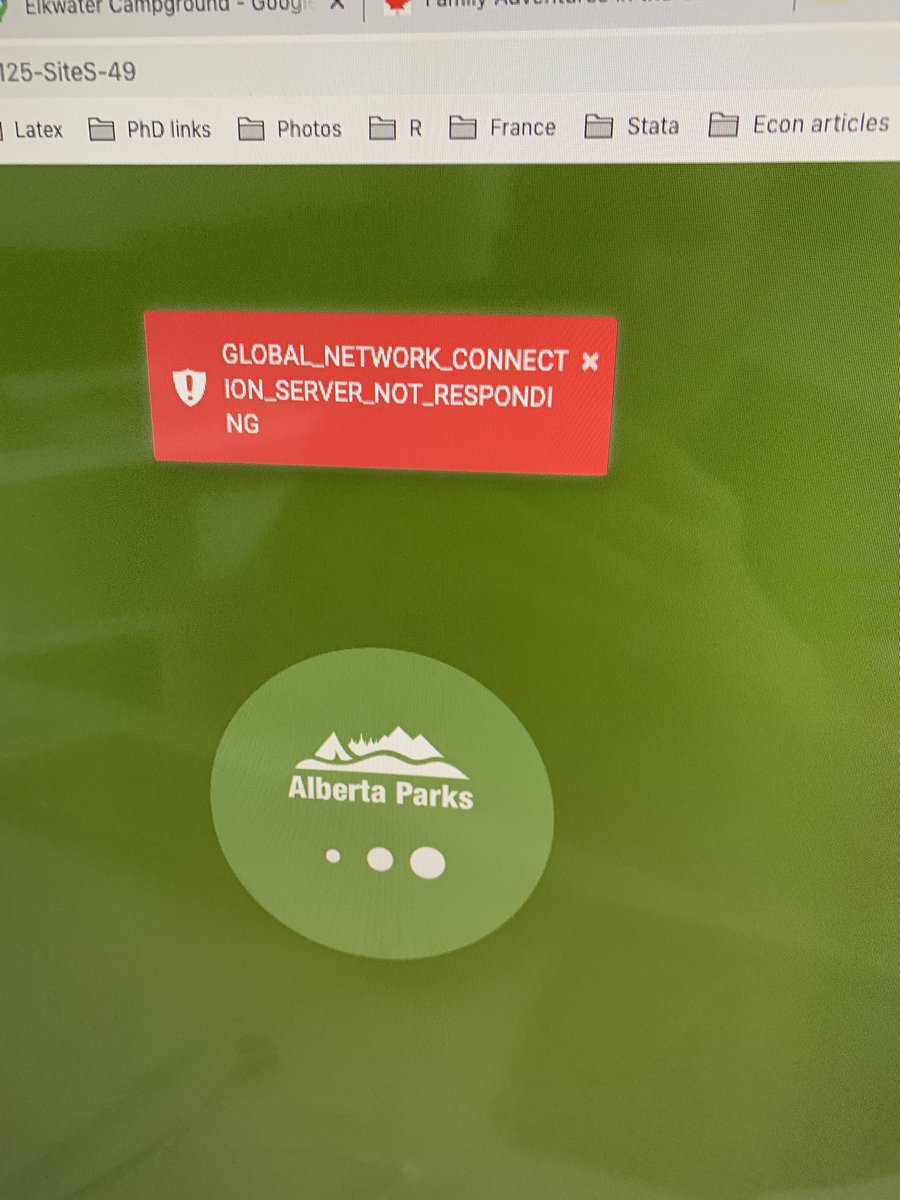
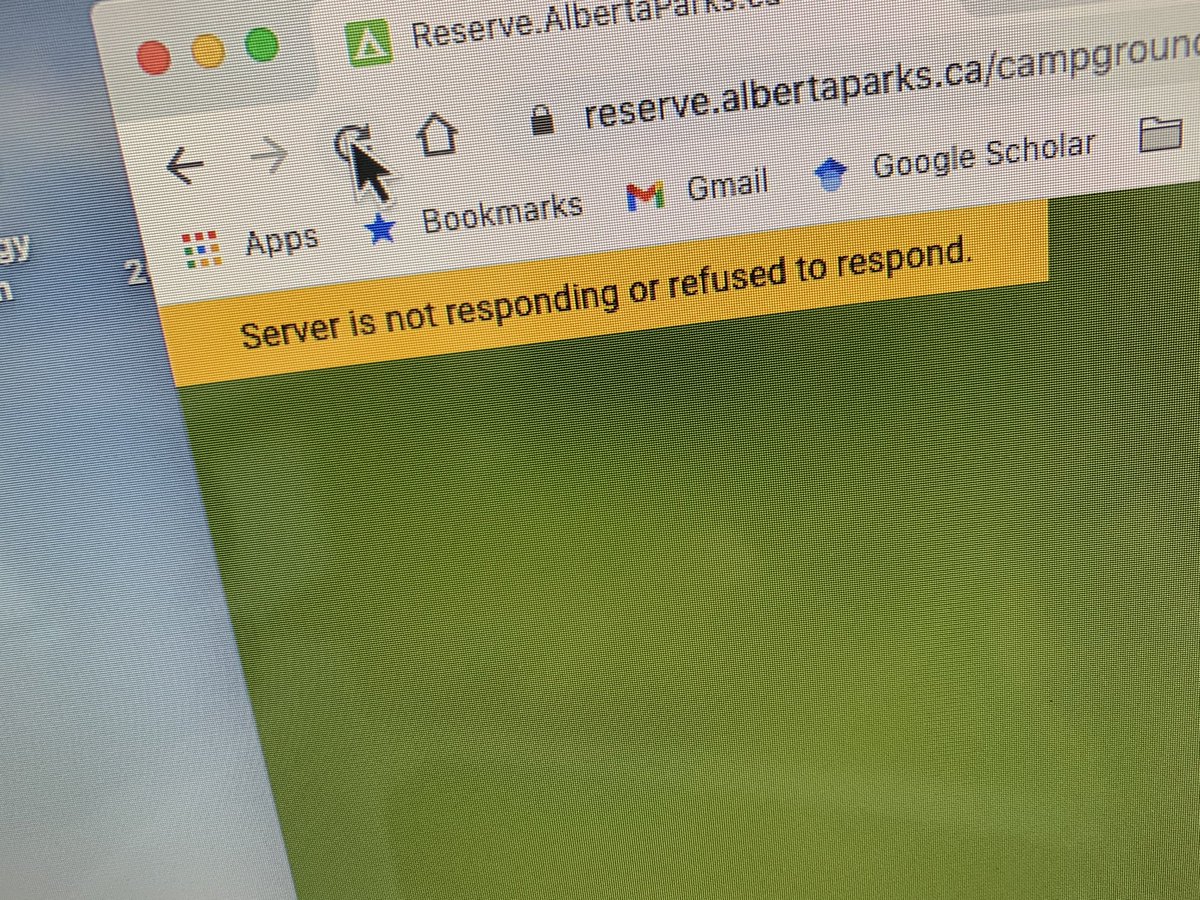
Interminable dots from hell...
Me, an hour ago: I'm going to pick site S-49, then if not that one, B-45, and then my choice is...

Me, now: I WILL TAKE ANYTHING. Make the dots stop spinning.

• • •

Missing some Tweet in this thread? You can try to force a refresh
 

Keep Current with Blake Shaffer 📊

Blake Shaffer 📊 Profile picture

Stay in touch and get notified when new unrolls are available from this author!

Read all threads

This Thread may be Removed Anytime!

PDF

Twitter may remove this content at anytime! Save it as PDF for later use!

Try unrolling a thread yourself!

how to unroll video
  1. Follow @ThreadReaderApp to mention us!

  2. From a Twitter thread mention us with a keyword "unroll"
@threadreaderapp unroll

Practice here first or read more on our help page!

More from @bcshaffer

3 Mar
A quick thread on the interconnectedness of power and NG markets. Others have discussed the interdependence and asymmetries of these two energy markets (e.g. @CostaSamaras & @MichaelEWebber).

I want to talk about how the Texas cold snap propagated through power & gas markets.
Let's start with Texas itself. Here's North Hub day-ahead market prices for power during the event. Pinned at $8000-9000/MWh through the event. Now back to a more typical $20. Image
And here's gas in Texas, namely the Waha hub in West Texas. Reaching $200/MMbtu, from a more typical $2-3. Other points reached even higher prices.

The demand for gas for both direct heat and power gen clearly links these two commodities within Texas. Image
Read 9 tweets
24 Feb
Quick (chart) thread on Ercot generation during the power outages.

Can't recall who made this plot, but it's excellent (albeit without y-axes!!).

Changes over time are informative, but not the whole story.
In terms of how each fuel type performed, we not only want to judge its absolute production, but also relative to what was expected of it.

Ercot did a Winter 2020/21 resource adequacy assessment in November and came up with the following:
67GW thermal+hydro
7GW wind
0.3GW solar
They also ran "risk scenarios", essentially more thermal outages or less wind. Interestingly they didn't run the extreme forced thermal outage *AND* the extreme low wind scenario together!
Read 10 tweets
15 Jun 20
Change in capacity utilization for Canadian manufacturing from Feb to April. Transportation equipment leads the decline.
Some @accidental_aRt making that chart...
Change in dollar value of manufacturing sales, indexed to Jan 2020, across Canadian provinces. NL and ON lead the way on % changes (ON leads the way in overall dollar decline)
Read 4 tweets
3 Oct 19
Quick dive into @StatCan_eng's quarterly population estimates released on Monday.

Series of charts coming... #cdnecon #cdnpoli 🇨🇦👨‍👩‍👦‍👦
@StatCan_eng Let's start with quarterly population change for Q2 2019. Prince Edward Island led the way, clearly due to tourists visiting Anne of Green Gables, falling in love with the place, and remaining.

Overall, Canada grew by 0.5% in the quarter.
@StatCan_eng Year-on-year, Canada grew by 1.4%. Again, PEI led the way. AB, Nunavut and Ontario also above the national average.
Read 11 tweets
24 Aug 19
1/ The report cited below is flawed. It is akin to a report finding the UCP cutting spending by 50% would have a devastating effect on public services--regardless of whether that is actual policy.

In short, the report does NOT analyze actual Fed carbon policy.

Let me explain..
2/ The report assesses the cost impact of a $50 carbon tax and assesses the competitiveness effect on energy-intensive trade-exposed industries. It mentions Fed policy includes an “output-based pricing system” to mitigate these concerns, but *excludes* it from the analysis.
3/ Report: “firms make decisions based on marginal costs whereas the OBPS rebate will be a lump-sum transfer and thus will not have much effect at the margin”.

This is wrong. Output-based allocations depend on… output! By their very nature they affect decisions at the margin.
Read 11 tweets
25 Jul 19
My take on today’s Alberta electricity market announcement. A brief thread.
First, a disclosure. I was hired by this government to provide advice into this process through a report. I hope that report is made public. My comments will be (relatively) brief in light of that.
In 2017 there were 4 options on the table:
1. energy only with a higher cap
2. capacity mkt
3. long term supply contracts
4. cost of service regulation
Read 13 tweets

Did Thread Reader help you today?

Support us! We are indie developers!


This site is made by just two indie developers on a laptop doing marketing, support and development! Read more about the story.

Become a Premium Member ($3/month or $30/year) and get exclusive features!

Become Premium

Too expensive? Make a small donation by buying us coffee ($5) or help with server cost ($10)

Donate via Paypal Become our Patreon

Thank you for your support!

Follow Us on Twitter!