Family incomes of Univ of Colorado System students in these distributions of income:
Top 25%= 58% of students
Top 10%= 41%
Top 5% = 28%
Top 1% = 8%
If this is actually System (all 4 campuses) then CU Boulder is even more skewed
Of 1191 public universities in the Chettey et al 2020 database, only the University of Michigan has a greater proportion of rich students than does Univ of Colorado
🧵Some technical details following my post on the SCC
Here are cumulative CO2 emissions (FFI) to 2300 for each of the 5 USG scenarios (4 are BAU & 1 is policy), along with the extended RCP8.5 & 2 net-zero scenarios (for 2100 and 2200)
Let me emphasize how ridiculous this is🤡
Looking at the high (USG2) and low (USG5) scenarios gives a 2300 temperature increase of as much as >9 degrees C
I have annotated the figure with the red line indicating 3 deg C which occurs as early as ~2070 under USG2
Ok, now let's look at the IAM damage functions
Here I have annotated the figure by adding the red line denoting 3 deg C
Note that the vast majority of damage occurs >3 deg C (& up to 3C is ~0 +/-)
Research highlighted by US gov't to serve as basis for new SCC estimates all comes from just one group -- the Climate Impacts Lab
Left panel - IWG figure
Right panel - Original
It is interesting and odd because the Climate Impact Lab is a spin-off of a Steyer-Bloomberg-Paulson funded effort that really launched RCP8.5 into a more prominent position in science and policy
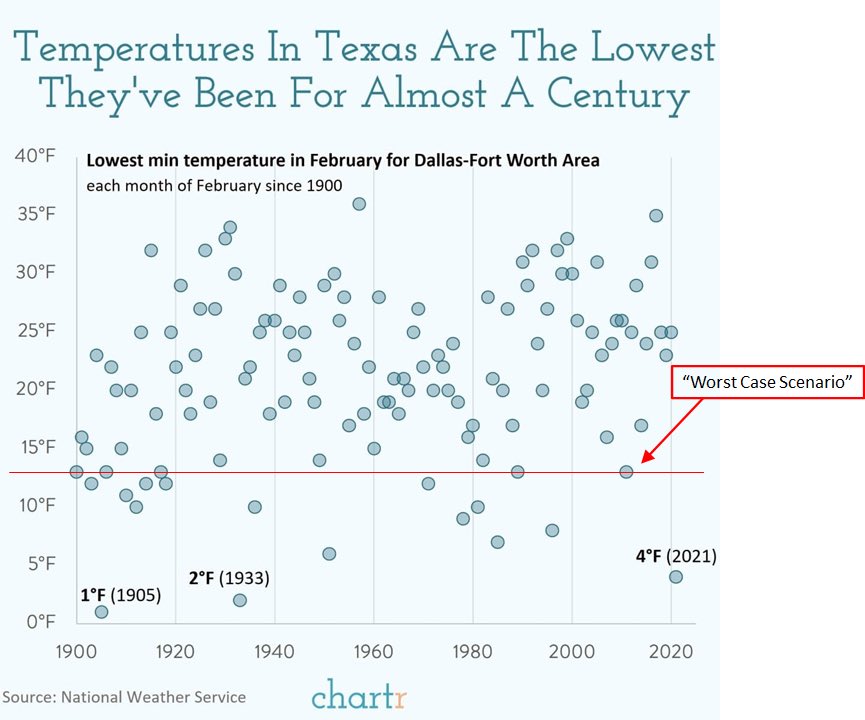
Where does 2011 sit in terms of recent history?
EIA has heating degree days for "West South Central" US (TX, OK, AR, LA)
Turns out 2011 ranks 24th most HDD for the region since 1973
2011 was not a "worst case" -- not even close
Source: eia.gov/energyexplaine…