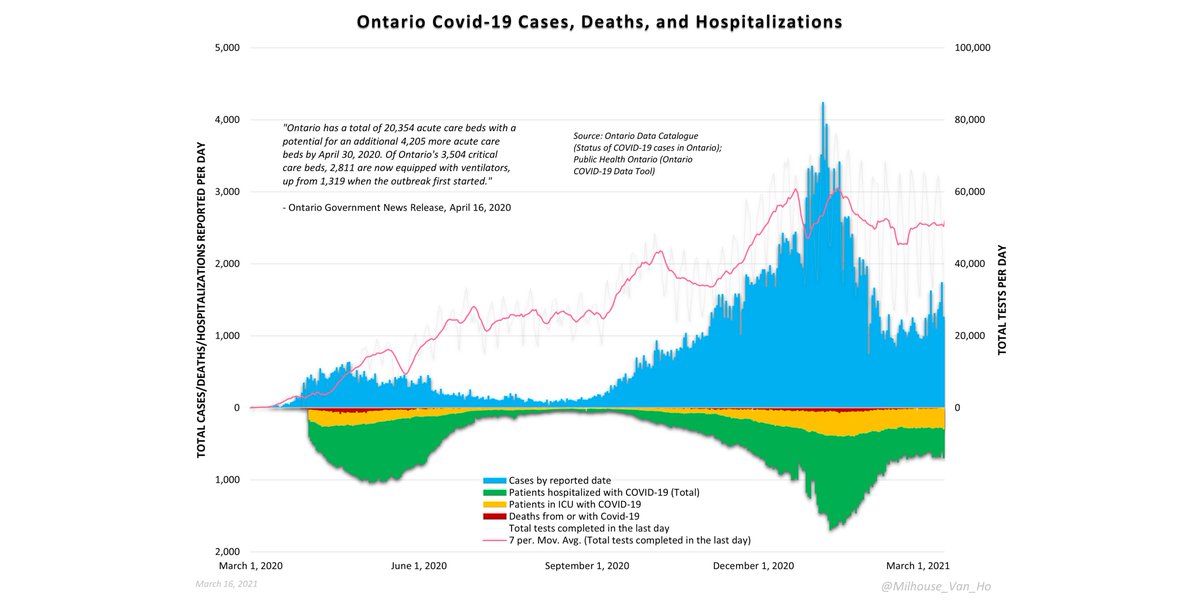
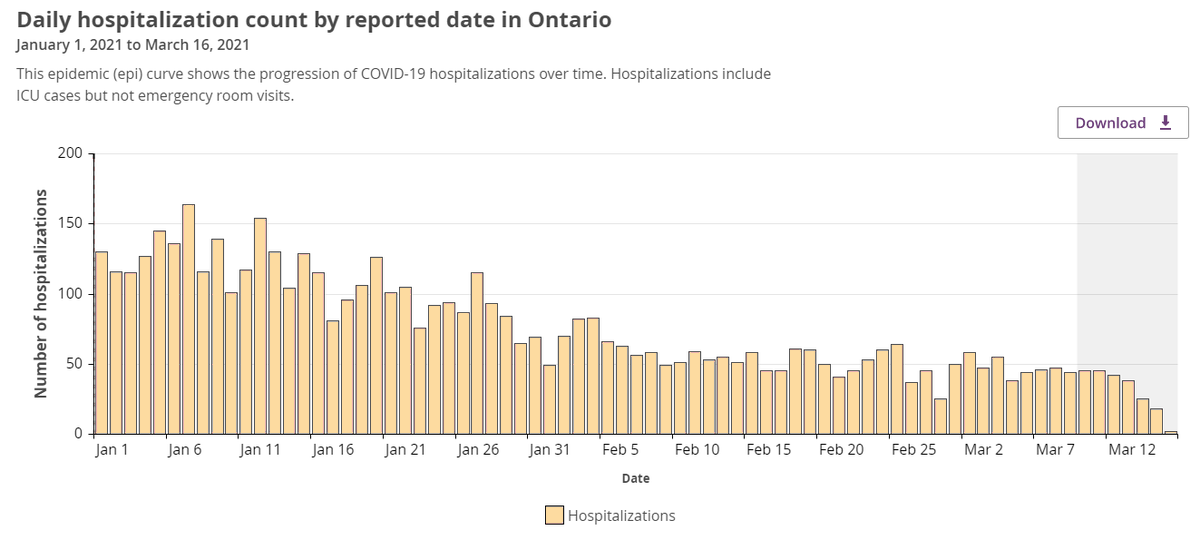
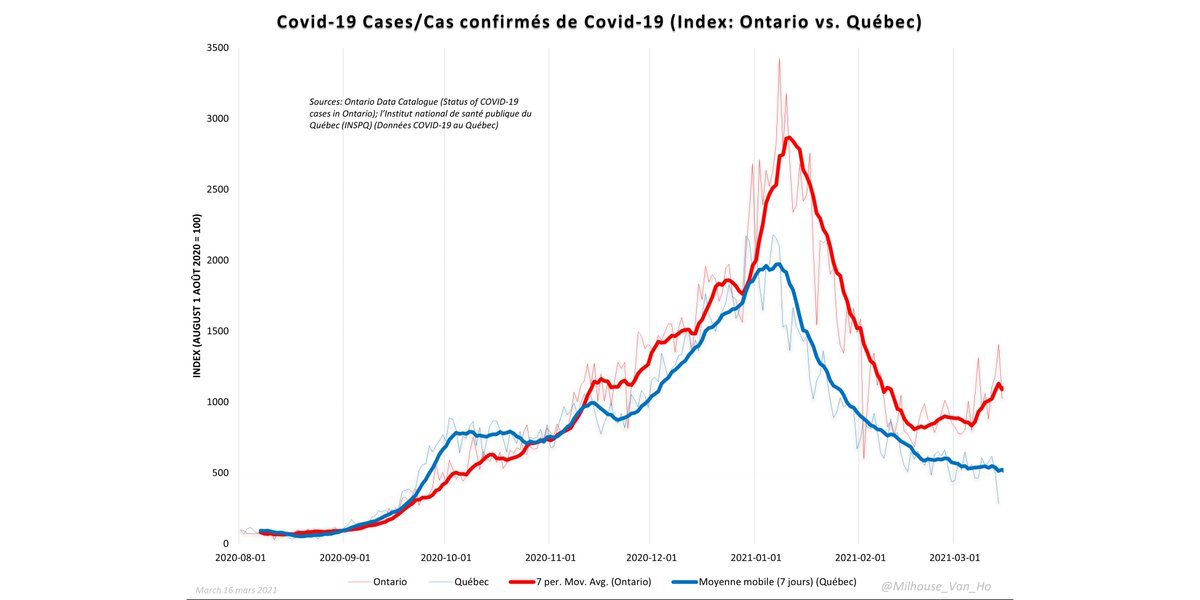
[UPDATED] I suspect there's something artificial about Ontario's case numbers because they no longer match hospitalization and death trends, nor comparable trends in neighbouring Québec.

Ontario's "third wave" may have been engineered through PCR case counts.

Thread:
Charts demonstrating covid seasonality.

Neighbouring provinces of Ontario and Québec both peaked at virtually the same time. However, cases trending up again in Ontario - but not in Québec.
On the contrary, hospitalizations in both provinces are still trending downward in unison.
Likewise, deaths are also trending downward in both provinces.
Looking closely at Ontario specifically, the uptick in cases since early/mid February doesn't conform at all to the continued decline in hospitalizations and deaths.
Meanwhile in Québec, all three metrics continue to decline.

• • •

Missing some Tweet in this thread? You can try to force a refresh
 

Keep Current with Milhouse Van Houten 😀

Milhouse Van Houten 😀 Profile picture

Stay in touch and get notified when new unrolls are available from this author!

Read all threads

This Thread may be Removed Anytime!

PDF

Twitter may remove this content at anytime! Save it as PDF for later use!

Try unrolling a thread yourself!

how to unroll video
  1. Follow @ThreadReaderApp to mention us!

  2. From a Twitter thread mention us with a keyword "unroll"
@threadreaderapp unroll

Practice here first or read more on our help page!

More from @Milhouse_Van_Ho

18 Mar
The number of deaths from all causes in 2019 vs. number of deaths from or with Covid-19 in 2020-21. Image
The average age of a death by or with covid-19 is higher than life expectancy.

Deaths among those over 80 account for 69% of deaths by/with covid-19, but only 51% of all deaths (all causes) in 2019. Image
If you are under 70, your risk of dying after being infected with SARS-CoV-2 is lower than your annual risk of death.

If you are over 70, your risk of dying after being infected is slightly higher than your annual risk of death. Image
Read 17 tweets
18 Mar
Don't just take my word for it. Official data shows that covid hospitalizations in Ontario are declining and are still below historical levels.

1. ACES Pandemic Tracker data:

kflaphi.ca/aces-pandemic-… Image
2. Public Health Ontario data (province-wide): Image
3. Public Health Ontario data (Toronto): Image
Read 4 tweets
17 Mar
Interesting insights into the closed-minded thinking of Ontario Science Table (OST) members, via @DFisman.

From an anon source, here @DFisman is being asked whether we should be having a scientific discussion about lockdowns, masks, and the long-term plan. ImageImage
In response even @DFisman admits that lockdowns are ineffective and have done significant damage to the economy, all without preventing people from needing the ICU. Image
Here @DFisman compares our current situation to the Spanish flu.

(Side note: no data suggesting that ICUs are/were under more pressure than in a normal year.) Image
Read 5 tweets
17 Mar
Greater Toronto update (thread).

#covid19 #covid19toronto #covid19ontario

City of Toronto cases, hospitalizations, deaths. Image
City of Toronto - The proportion of cases (positive test results) resulting in death (yellow line). Image
Greater Toronto cases, hospitalizations, deaths. Image
Read 8 tweets
16 Mar
Ontario update.

#covid19ontario #COVID19 #covid19Canada

Ontario covid-19 cases, hospitalizations, deaths, and testing.
Ontario covid-19 cases, deaths, and testing.
Ontario Fall/Winter season: May be able to declare a peak when average week-over-week growth reaches zero.
Read 15 tweets

Did Thread Reader help you today?

Support us! We are indie developers!


This site is made by just two indie developers on a laptop doing marketing, support and development! Read more about the story.

Become a Premium Member ($3/month or $30/year) and get exclusive features!

Become Premium

Too expensive? Make a small donation by buying us coffee ($5) or help with server cost ($10)

Donate via Paypal Become our Patreon

Thank you for your support!

Follow Us on Twitter!