THREAD: Net-zero emissions
What is the the different between zero & net-zero? CO₂ or GHG?
Does net-zero mean emissions continue but are offset by Carbon Dioxide Removal (CDR)? (no)
Based on a presentation: slideshare.net/GlenPeters_CIC…
What is the the different between zero & net-zero? CO₂ or GHG?
Does net-zero mean emissions continue but are offset by Carbon Dioxide Removal (CDR)? (no)
Based on a presentation: slideshare.net/GlenPeters_CIC…

2. First, why is "net-zero" needed in the first place?
Science shows that the temperature stops rising when CO₂ emissions reach (net-)zero.
There are non-CO₂ emissions, but they have a smaller (secondary) effect & declining emissions may be sufficient
cicero.oslo.no/no/posts/klima…
Science shows that the temperature stops rising when CO₂ emissions reach (net-)zero.
There are non-CO₂ emissions, but they have a smaller (secondary) effect & declining emissions may be sufficient
cicero.oslo.no/no/posts/klima…
3. Zero emissions:
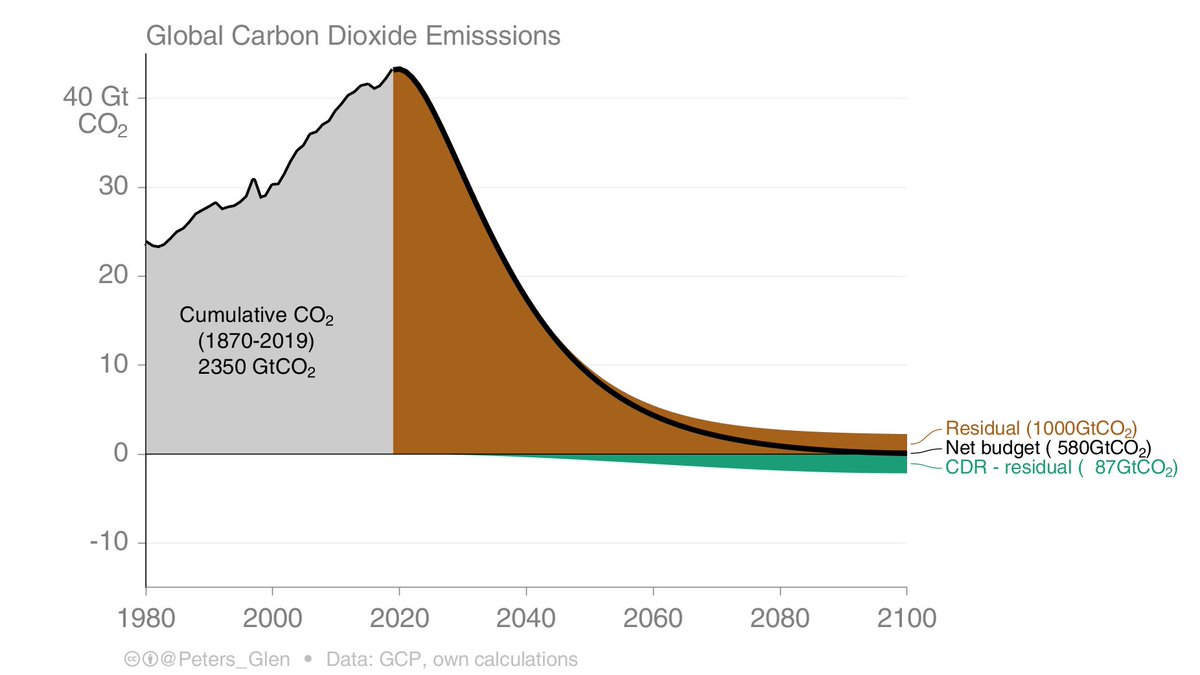
If we take a remaining carbon budget consistent with 1.5°C, then emissions need to drop rapidly. This curve converges to zero, there is no physical reason to have a straight line to zero.
(I took 580GtCO₂ from SR15 Table 2.2, not adjusted for time past)
If we take a remaining carbon budget consistent with 1.5°C, then emissions need to drop rapidly. This curve converges to zero, there is no physical reason to have a straight line to zero.
(I took 580GtCO₂ from SR15 Table 2.2, not adjusted for time past)

4. Net-zero emissions
It is likely that it is not possible to avoid all CO₂ emissions, & some carbon dioxide removal (modest scale) may be used to balance continued CO₂ emissions.
Rapid-short term reductions still needed...
It is likely that it is not possible to avoid all CO₂ emissions, & some carbon dioxide removal (modest scale) may be used to balance continued CO₂ emissions.
Rapid-short term reductions still needed...

5. Net-zero & net-negative emissions
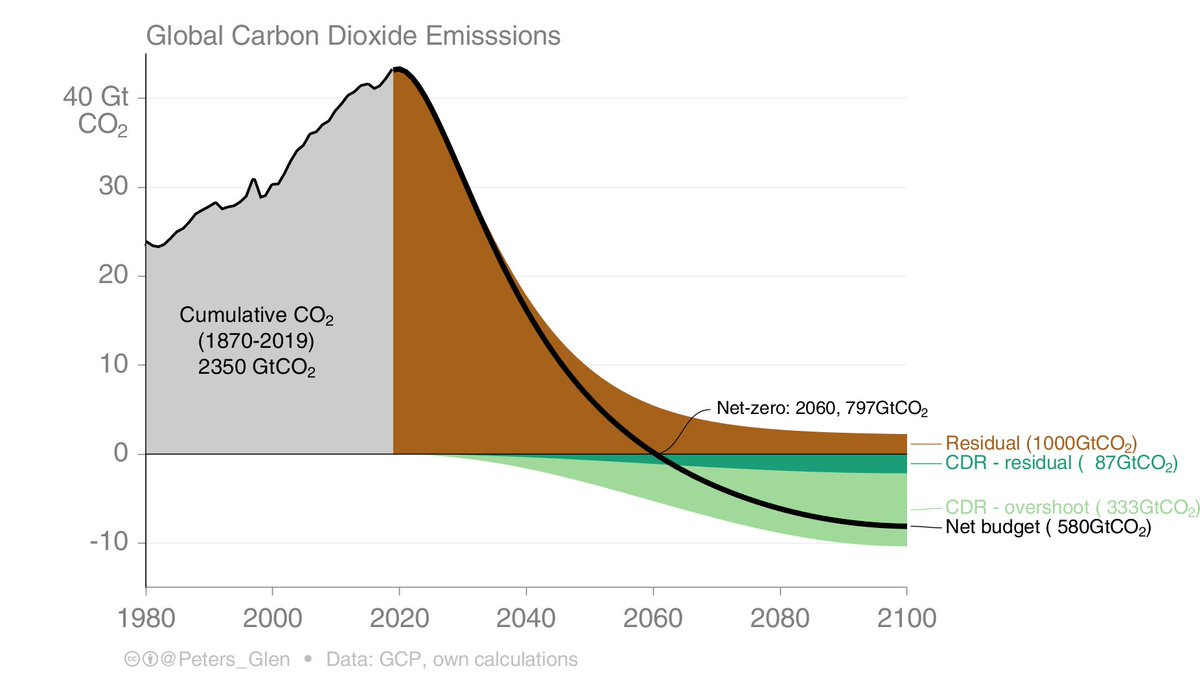
This is what most scenarios actually look like. They have large-scale CDR. The temperature exceeds 1.5°C & then comes back to 1.5°C later (I assumed 2100).
Net-zero is just on the path to net-negative...
This is what most scenarios actually look like. They have large-scale CDR. The temperature exceeds 1.5°C & then comes back to 1.5°C later (I assumed 2100).
Net-zero is just on the path to net-negative...

6. As @KevinClimate will happily explain, there is trouble with negative emissions at this scale...
science.sciencemag.org/content/354/63…
While net-zero emissions could be justified (tweet 4), the problem is net-zero emissions is often just a step on the way to net-negative on steroids!
science.sciencemag.org/content/354/63…
While net-zero emissions could be justified (tweet 4), the problem is net-zero emissions is often just a step on the way to net-negative on steroids!

7. Coincidentally, @JoeriRogelj, @Oliver_Geden, @CowieAnnette, @ReisingerAndy had a nice commentary explaining how to fix net-zero targets.
It addresses many issues with net-zero targets, but net-zero is still on the way to large-scale net-negative!
nature.com/articles/d4158…
It addresses many issues with net-zero targets, but net-zero is still on the way to large-scale net-negative!
nature.com/articles/d4158…

8. Large-scale net-negative emissions (& declining non-CO₂) mean that temperatures peak (around net-zero CO₂) & then temperature declines.
There is interesting science on the role of CO₂ & non-CO₂ in the declining temperature (but the GWP100 for non-CO₂ really does confuse)
There is interesting science on the role of CO₂ & non-CO₂ in the declining temperature (but the GWP100 for non-CO₂ really does confuse)

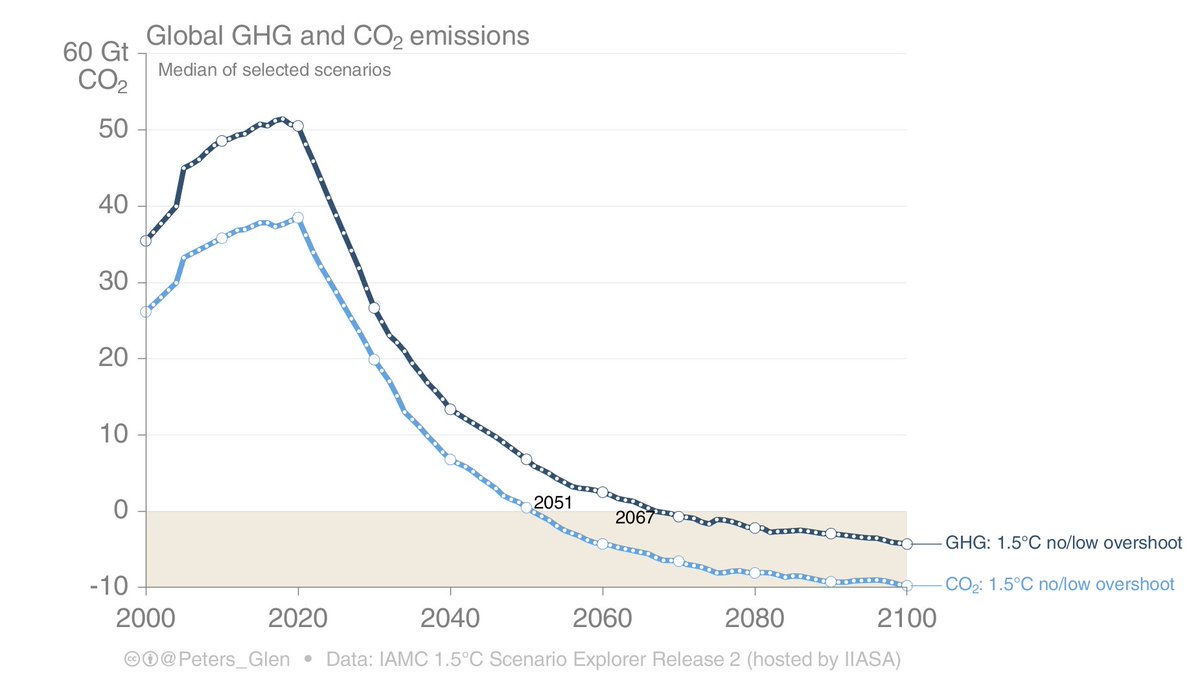
9. The above scenario is illustrative, but we can take one that has much less CO₂ removal (the Low Energy Demand that was profiled in SR15).
While this scenario reaches net-zero CO₂ emissions, it does not reach net-zero GHGs before 2100 (as 'required' in the Paris Agreement).
While this scenario reaches net-zero CO₂ emissions, it does not reach net-zero GHGs before 2100 (as 'required' in the Paris Agreement).

10. Article 4 in the Paris Agreement ('balance' of GHG emissions by 2100) is not really necessary & seemingly based on scenarios with large-scale CO₂ removal?
The 'best available science' (Art. 4) would say a balance in GHG is not needed (but likely needed for CO₂ emissions)
The 'best available science' (Art. 4) would say a balance in GHG is not needed (but likely needed for CO₂ emissions)

11. It is well understood that net-zero CO₂ emissions occur 10-20 years before net-zero GHG emissions, & going from 1.5°C to <2°C makes net-zero about 20 years later (& even not necessary).
Emission metrics are important (& confusing) on net-zero GHGs. royalsocietypublishing.org/doi/full/10.10…
Emission metrics are important (& confusing) on net-zero GHGs. royalsocietypublishing.org/doi/full/10.10…

12. A big issue with net-zero is that it is misunderstood as just meaning tinkering with emissions while buying removals or offsets.
This is my extreme version of the consequences, but @JoeriRogelj et al explain these issues far, far better than I could nature.com/articles/d4158…
This is my extreme version of the consequences, but @JoeriRogelj et al explain these issues far, far better than I could nature.com/articles/d4158…

13. In my view, net-zero is okay, but we have to get out of this large-scale dominance of Carbon Dioxide Removal in scenarios.
Net-zero means:
1. Stop putting CO₂ in the atmosphere
2. As a last step, use CO₂ removal to clean up any remaining mess.
Net-zero means:
1. Stop putting CO₂ in the atmosphere
2. As a last step, use CO₂ removal to clean up any remaining mess.

14. Check out my presentation
slideshare.net/GlenPeters_CIC…
And you should find a recording here soon klimastiftelsen.no
(NB: In the presentation I did not go into the weeds of large-scale CDR, that was only for Twitter!)
slideshare.net/GlenPeters_CIC…
And you should find a recording here soon klimastiftelsen.no
(NB: In the presentation I did not go into the weeds of large-scale CDR, that was only for Twitter!)
• • •
Missing some Tweet in this thread? You can try to
force a refresh


