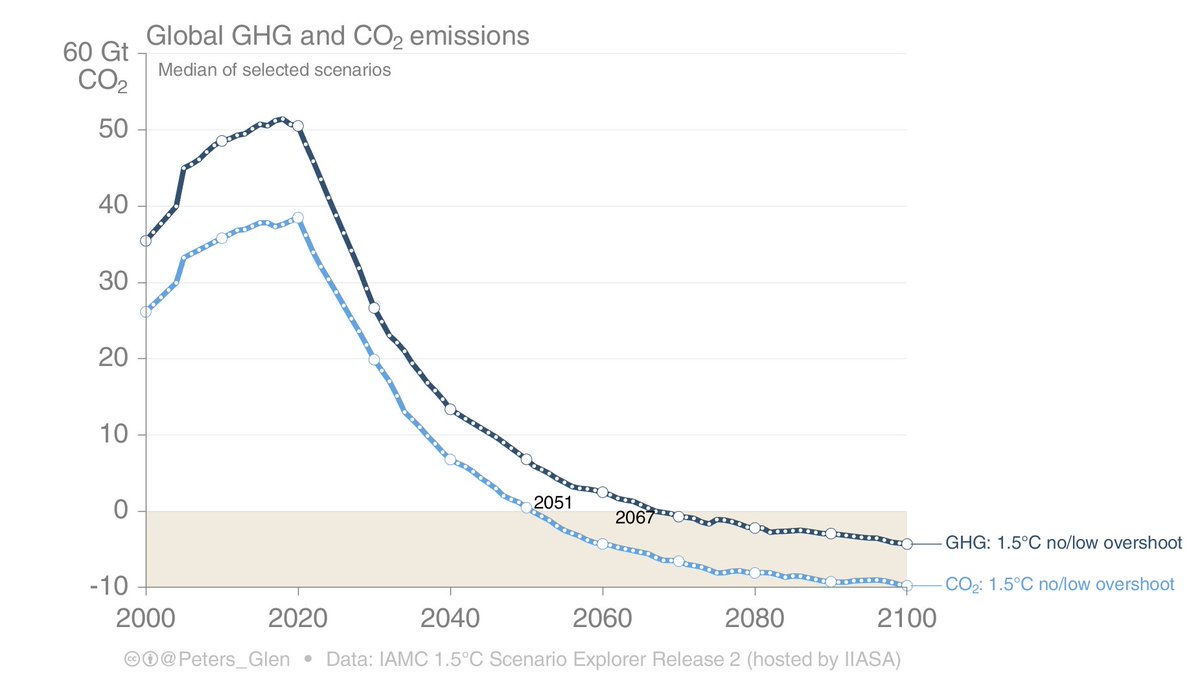
IPCC: "In model pathways with no or limited overshoot of 1.5°C, global net anthropogenic CO₂ emissions [reach] net zero ~2050 (2045–2055)"
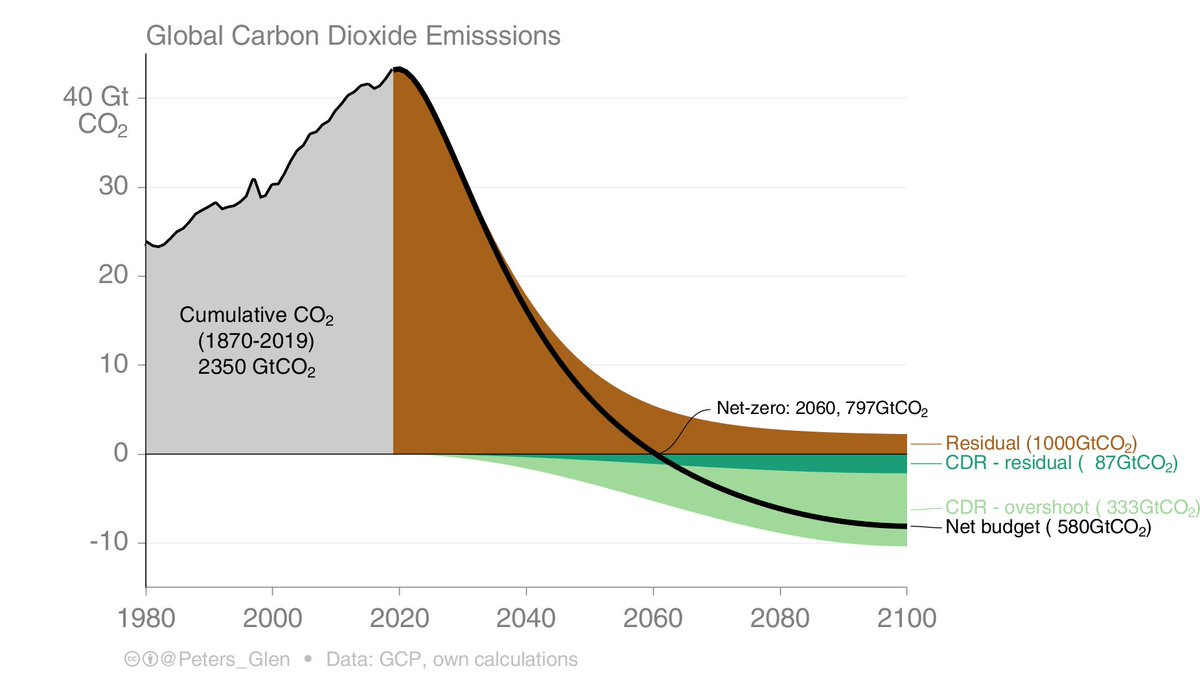
There are likely equally plausible scenarios (shown here) that reach net-zero CO₂ emissions in 2100 with the same 'carbon budget'.
1/
There are likely equally plausible scenarios (shown here) that reach net-zero CO₂ emissions in 2100 with the same 'carbon budget'.
1/

You don't believe me?
These are the scenarios used for net-zero ~2050 (2045-2055). They basically all cross zero around 2050. This is because they focus on 2100 targets & allow 'overshoot'.
This is a design feature of the scenarios, & are not the only way to get to 1.5°C!
2/
These are the scenarios used for net-zero ~2050 (2045-2055). They basically all cross zero around 2050. This is because they focus on 2100 targets & allow 'overshoot'.
This is a design feature of the scenarios, & are not the only way to get to 1.5°C!
2/

The temperature response to those scenarios all have a 'peak & decline' shape. Some of the 'peak & decline' is due to CO₂ emissions & some to non-CO₂ emissions (GWP100 confuses this point).
Most modelling uses a 2100 target, allowing overshoot (a cost-effective 'feature').
3/
Most modelling uses a 2100 target, allowing overshoot (a cost-effective 'feature').
3/

All our climate policy is based on scenarios to the left, instead of scenarios to the right.
I say this is a problem...
More info:
4/4

I say this is a problem...
More info:
https://twitter.com/Peters_Glen/status/1372478605377339392
4/4


• • •
Missing some Tweet in this thread? You can try to
force a refresh


