Data from Mumbai's latest COVID-19 wave is suggesting that reinfections are important and/or a more transmissible variant is circulating. Here's why. (A slightly technical thread, assumptions and possible objections at the end.) (1/n)
First, the argument in brief: current spread is just too fast. The speed is at odds with levels of prior infection in the city and what we know about R0 - the basic reproduction number in the city - based on the earliest availale data.
The current doubling time for daily cases (weekly average) is ~8 days. With TPR also rising sharply, the true doubling time for infections may be shorter. With standard assumptions, we get R = ~1.57. Estimated cases from slums and nonslums give roughly the same R value in both.
Mumbai's early case and death data gives doubling times of ~3 to 4 days, corresponding to R0 = ~2.5 to 3.3. This data (esp. fatalities) reflects COVID spread in mid March when there was basically no mitigation. R0=2.9 works well in simulations to explain Mumbai's early data.
Mumbai's current levels of prior infection are *at least* 50%. In fact, >60% is more plausible. There are many ways to argue this. To begin with, the first serosurvey in July gave prior infection estimates of 35% citywide. (For reasons discussed later, this is conservative)...
...Since then, COVID-19 cases have quadrupled. More importantly, recorded deaths have more than doubled. Even with greater spread in nonslum areas with higher (recorded) death rate, *at least* another 15% of the city has been infected since July. Probably more like another ~25%.
With 50% acquired immunity, and *without NPIs* R should be half of R0, namely 1.25-1.65. The current estimate (1.57) is near the upper end of this range. But NPIs are still in place: educational institutions are closed, gatherings are limited, tranport is still restricted, etc.
At a more credible prior infection level of 60%, R should be in the range 1 to 1.3 without mitigation. Mild mitigation which removes about a quarter of infection spreading events would push R below 1. If these estimates are correct, what could explain the rapid growth in cases?
1) A significant level of reinfections, due to either waning protection or, possibly, a variant evading existing immunity; and/or
2) A more transmissible circulating variant pushing up R.
Objection 1. The first serosurvey may have overestimated citywide prevalence. Possible, but 1) the surveyed wards had in fact been *less* badly hit than the city average by the time of the survey. 2) Sample sizes were good, and the sampling was carefully designed to avoid biases.
In fact, the estimate of 35% prior infection by early July is *conservative*, using rather low values of slum density, ignoring waning sensitivity of the test, and ignoring the fact that the surveyed wards were less badly hit. Data from the second serosurvey backed this up...
The second serosurvey showed somewhat reduced slum seroprevalence, reflecting waning sensitivity of the assay used. Taking both surveys together, data-driven estimates put *minimum* prior infection at the time of the second serosurvey (late August) at 43%.
science.thewire.in/health/mumbai-…
Objection 2. R0 based on early data could have been underestimated. The slums, where R0 is higher, were underrepresented in early data for two reasons: 1) the slum epidemic hadn't really taken off yet, and 2) detection of infections in the slums was poor...
...It is true that the slums are underrepresented in early data. But taking this into account and looking separately at the dynamics in slum and nonslum areas we still find the rapid doubling times in both strata hard to explain. For example...
There is evidence of very high prior infection in the slums. A survey in Oct. found 75% seroprevalence (little technical detail unfortunately). Even if slum R0 was ~5 (HIT=80%), then at 75% prior infection, current R should be ~1.25 without mitigation.
indiatoday.in/coronavirus-ou…
To conclude. Is there definitive evidence of reinfections, or immune evasion, or a more transmissible variant circulating in Mumbai? Not yet. But the balance of probabilities points strongly towards some combination of these playing an important part. (n/n)

• • •

Missing some Tweet in this thread? You can try to force a refresh
 

Keep Current with Murad Banaji

Murad Banaji Profile picture

Stay in touch and get notified when new unrolls are available from this author!

Read all threads

This Thread may be Removed Anytime!

PDF

Twitter may remove this content at anytime! Save it as PDF for later use!

Try unrolling a thread yourself!

how to unroll video
  1. Follow @ThreadReaderApp to mention us!

  2. From a Twitter thread mention us with a keyword "unroll"
@threadreaderapp unroll

Practice here first or read more on our help page!

More from @muradbanaji

15 Mar
(1/4) Brief 🧵on Mumbai's all cause mortality and COVID-19 infection fatality rate (IFR). 2020 data shows a huge 24% rise in mortality over the previous 5 year average. That's about 22K extra deaths in 2020. Of these about 11K were recorded COVID deaths.
portal.mcgm.gov.in/irj/portal/ano…
(2/4) We don't know exactly how many 2020 excess deaths were COVID deaths. These could range from the official 11K up to more than 22K, since there's evidence some kinds of mortality fell in 2020. Let's say COVID deaths in 2020 were between 11K and 24K.
(3/4) We don't know exactly how many infections occurred in 2020, but based on seroprevalence data and modelling, somewhere between 6.5M to 9M infections occurred in the city. That's between 50% and 70% of the population (~12.9M), if we assume reinfections were rare.
Read 4 tweets
23 Feb
This thread is troubling. Yes, India's data is interesting - let's acknowledge the complexities and uncertainties, but based on evidence and without wild claims. #thread
First of all, the premise of the thread - comparing recorded cases and deaths across countries is meaningless without acknowledging differences in surveillance. There's enough seroprevalence data to go beyond "cases"...
From the latest Indian survey, about 3.5% of infections have been detected (science.thewire.in/health/third-n…).

In the US, it's over 20% (cidrap.umn.edu/news-perspecti…).

So an India-US comparison of cases per million is highly misleading.
Read 20 tweets
6 Feb
For this piece, I tried to gather together some thoughts about the serosurvey data coming out of India. There is a great deal of this data, and the messages are important but not always clear. Longish #thread. 1/n
scroll.in/article/986097…
First, to see the bogus narratives you can construct when you ignore serosurvey data, you just have to look at Chapter 1 of the recent "Economic Survey". (This thread took just one example, but there are many.)
Key message from the serosurveys? Extremely variable surveillance of infections *and probably deaths*. In some places, a decent proportion of infections are picked up; in others a tiny fraction. Some areas have seen a huge number of infections, but almost no recorded deaths.
Read 16 tweets
5 Feb
My piece in The Wire on the third national serosurvey. The headline (~21% prevalence) is probably not a major underestimate. Apparently the antibody test used was less vulnerable to missing old infections than the one used in the second serosurvey. 1/6
science.thewire.in/health/third-n…
The increase in prevalence from 2nd to 3rd survey is roughly consistent with the increase in cases over this period.

The breakdown of prevalence suggests that disease was moving towards rural areas even as daily cases peaked and declined nationally (September). 2/6
Weaker rural surveillance of infections and deaths could explain a moderate drop in detection, and a more noticeable drop in the naive infection fatality rate (recorded deaths over estimated infections) between 2nd and 3rd national serosurveys. 3/6
Read 6 tweets
1 Feb
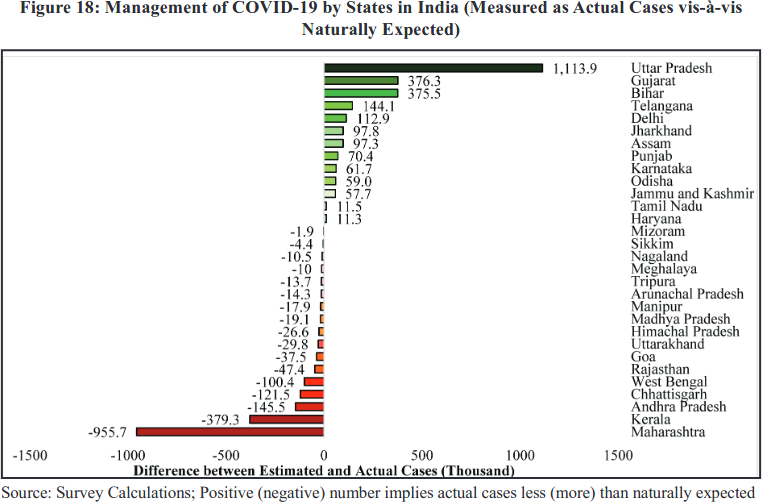
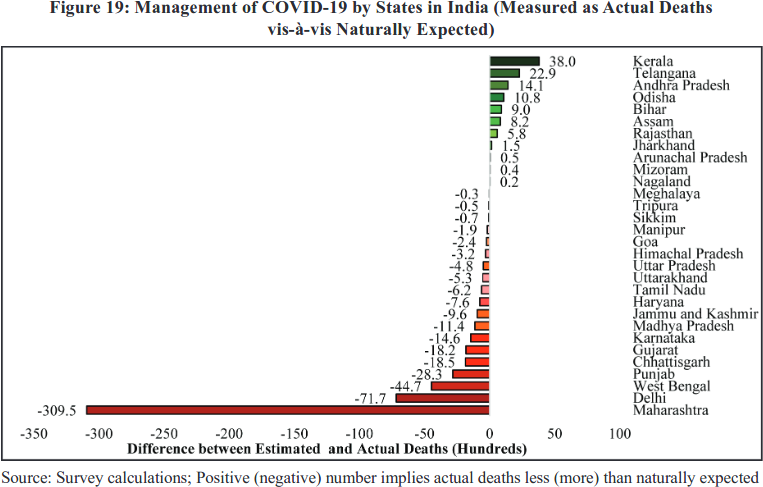
Chapter 1 of the Economic Survey 2020-21 (indiabudget.gov.in/economicsurvey/): a glowing report on the govt's handling of the COVID crisis, and a case study in what happens when science is abandoned for propaganda. Page after page of spin and dishonesty, but here's just one example... 1/5
...These two pictures show "actual vs. expected" cases and deaths for different states. Bihar does well (green) and Chhattisgarh does badly (red). Why? Because Bihar has fewer recorded COVID cases and deaths than "expected", and Chhattisgarh more than "expected". But... 2/5
I'd earlier examined data from Bihar and Chhattisgarh quite carefully for a piece in The Wire Science - measured cases, recorded deaths and, crucially, serosurvey data. The basic conclusions of this analysis were simple. In the surveyed districts... 3/5
science.thewire.in/health/bihar-c…
Read 5 tweets
31 Dec 20
Mumbai #COVID19 update. Things have improved - daily recorded cases and deaths are at about a quarter of second wave peak values. But there is still a steady stream of new infections. Mumbai's data forces us to ask: could reinfection be more common than we think? 1/10 Image
The recent picture:
- the second wave receded steadily, apart from a small post-Diwali blip
- daily cases, daily deaths and test positivity have all been declining
- but the epidemic is still not dying away. Image
Each day there are about 600 new cases. If we (optimistically) assume 1 in 10 infections are detected, and each infection is "active" for 10 days, that's 600X10X10 = 60,000 active infections = about 0.5% of the city. Low compared to May or September, but still surprisingly high.
Read 10 tweets

Did Thread Reader help you today?

Support us! We are indie developers!


This site is made by just two indie developers on a laptop doing marketing, support and development! Read more about the story.

Become a Premium Member ($3/month or $30/year) and get exclusive features!

Become Premium

Too expensive? Make a small donation by buying us coffee ($5) or help with server cost ($10)

Donate via Paypal Become our Patreon

Thank you for your support!

Follow Us on Twitter!