Interesting question. Made me think , so did some basic data analysis
https://twitter.com/Bijay_reborn/status/1374364131394945026
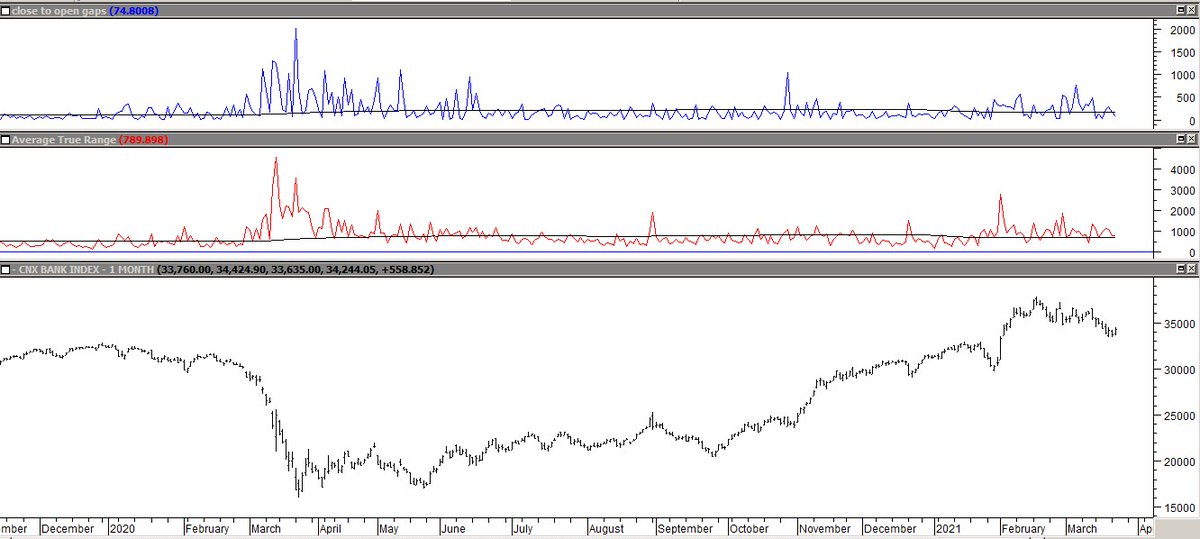
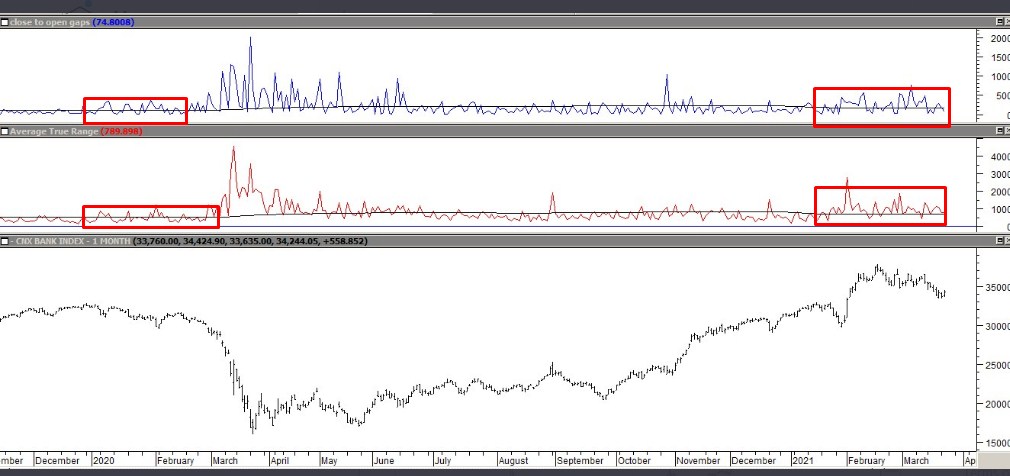
The bottom pane red line is 1 period ATR, the black line is a 200dma of 1atr. As we can see, intraday volatility/range is far above normal
The upper pane is the absolute value of close to next day open, again very high above average
The upper pane is the absolute value of close to next day open, again very high above average
Conclusions :
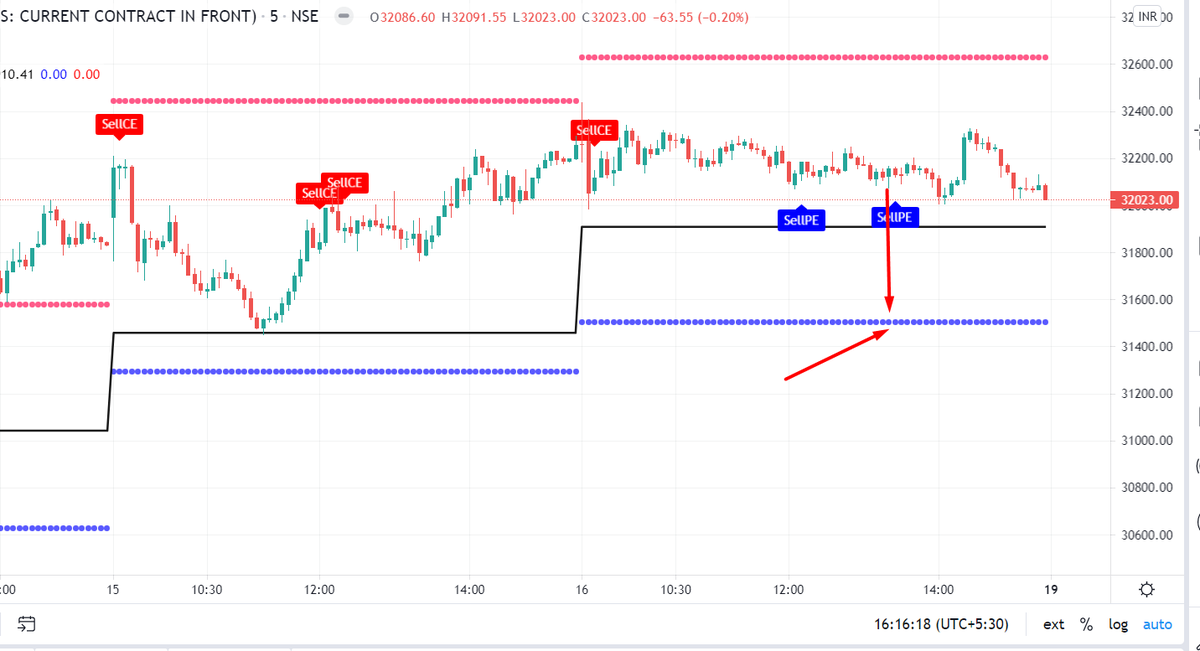
1. Intraday ranges giving huge opportunities
2. Overnight close to open gaps can kill if on opposite side
Hence, majority like us @Bijay_reborn have turned into majorly daytraders 😂
1. Intraday ranges giving huge opportunities
2. Overnight close to open gaps can kill if on opposite side
Hence, majority like us @Bijay_reborn have turned into majorly daytraders 😂
Had another look, this is freaky 😦
• • •
Missing some Tweet in this thread? You can try to
force a refresh