A major study was announced today with 12,000 college students to help understand the impacts of Covid-19 vaccination on further spread and transmission. @lindsayaellis discusses the project here, which is funded by NIAID. Short thread on the study:
chronicle.com/article/when-t…
chronicle.com/article/when-t…
The study will take place at 21 universities, many large institutions, nationwide. About half of the students will receive the vaccine injections right away, and the other half will receive the vaccine a few months later. The students will each identify “close contacts.” 
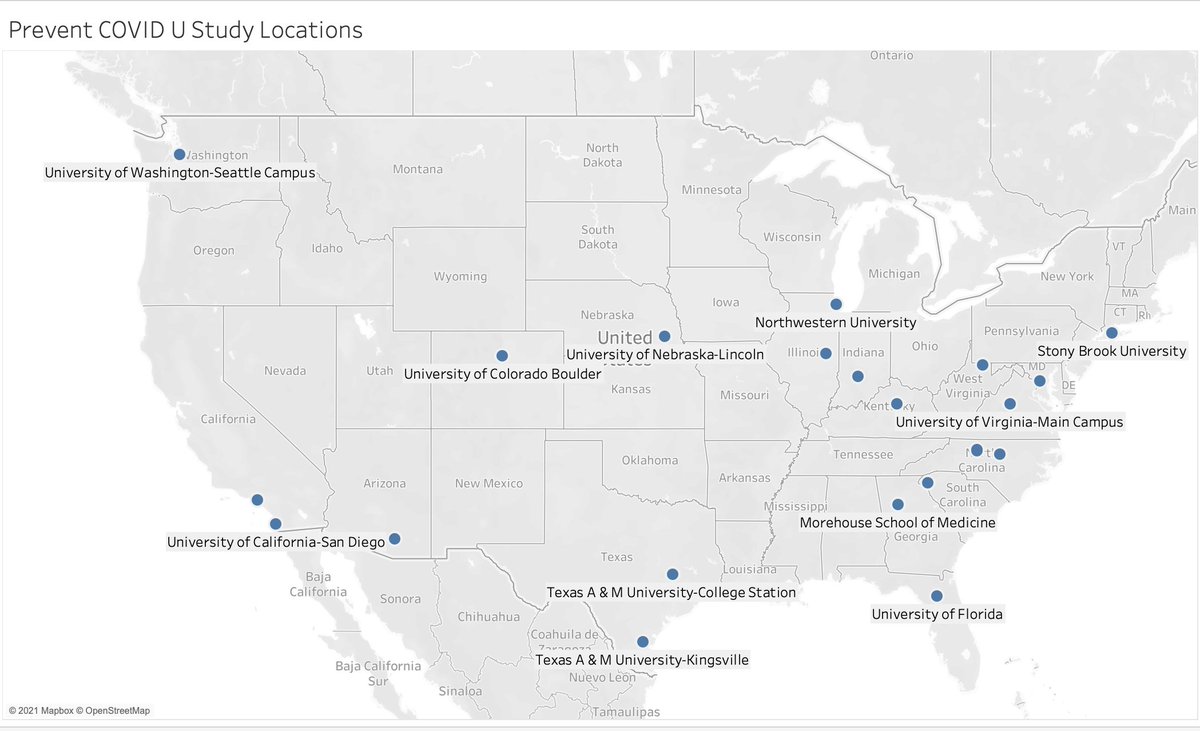
These close contacts, around 25,000 of them, will also be in the study. Information on specifics was presented in today's White House briefing. The clinical trial record is available here, for those interested in specific endpoints.
clinicaltrials.gov/ct2/show/NCT04…


clinicaltrials.gov/ct2/show/NCT04…
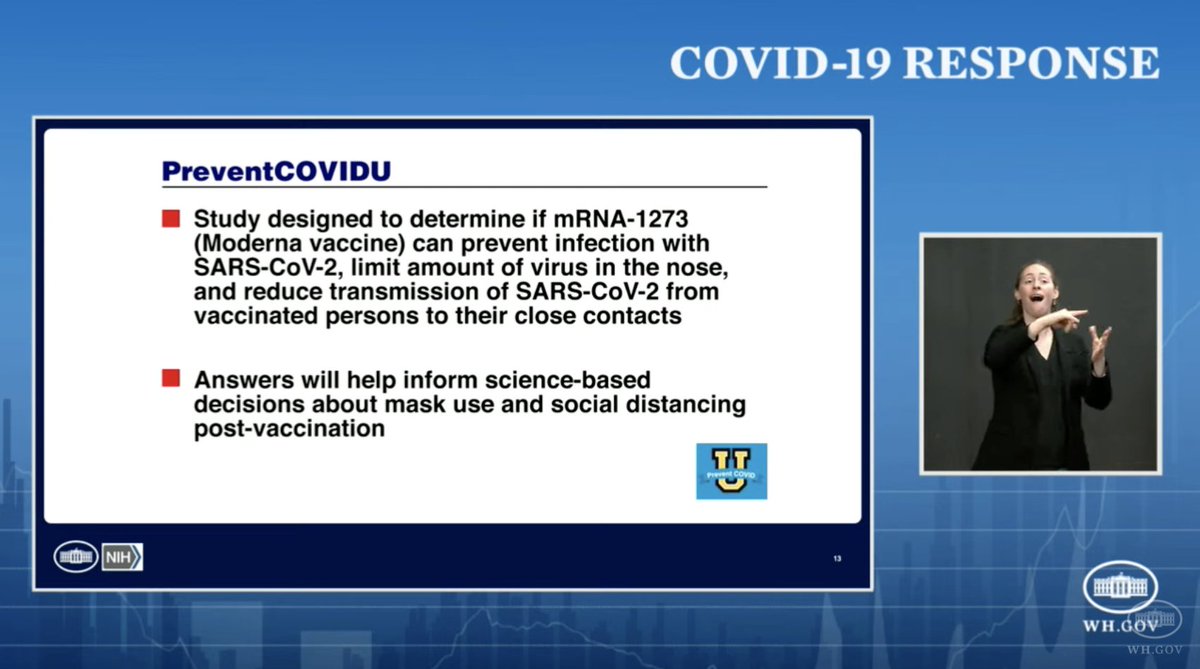

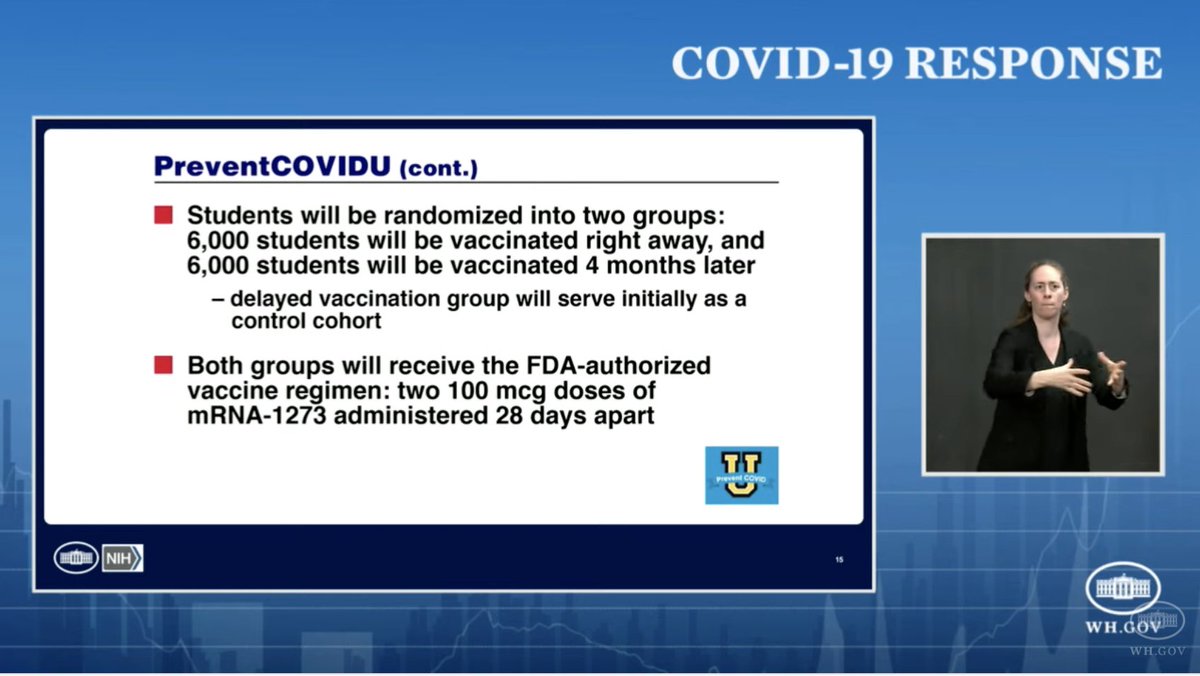
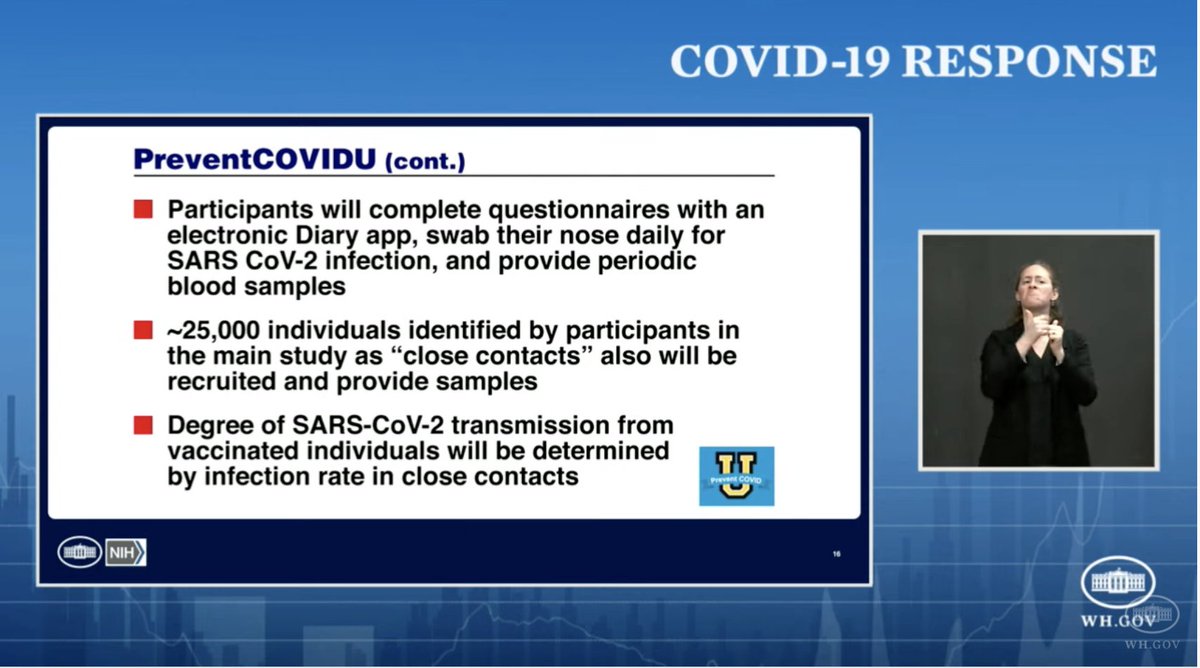
Key aspects of the study — results will be ready in time for the fall:
- Students will swab their noses daily for viral load measurements, as well as periodic blood samples
- Students will participate in twice-weekly testing through their university
fredhutch.org/en/news/center…
- Students will swab their noses daily for viral load measurements, as well as periodic blood samples
- Students will participate in twice-weekly testing through their university
fredhutch.org/en/news/center…
Students and contacts will also complete daily diary questionnaires. College students are ideal for this type of study as it can give us insight on asymptomatic spread. The daily swabs will enable researchers to see viral latency on a day-by-day basis.
nytimes.com/2021/03/26/sci…
nytimes.com/2021/03/26/sci…
Using college students in a study to determine the vaccine's reduction on transmission is not new. This study in particular, using the Moderna vaccine, was stalled in December due to lack of funding.
wsj.com/articles/covid…
wsj.com/articles/covid…
We have already seen preliminary evidence of viral load in college students. @DanLarremore and colleagues found that individuals who likely transmitted to their roommates had an average viral load ∼6.5 times higher than individuals who did not.
medrxiv.org/content/10.110…
medrxiv.org/content/10.110…
In a similar light, @Sara_Sawyer_ and colleagues found that "just 2% of individuals carry 90% of the virions circulating within communities, serving as viral “super-carriers” and possibly also super-spreaders."
medrxiv.org/content/10.110…
medrxiv.org/content/10.110…
The best way to determine the impact of vaccines on transmission is through frequent testing, and colleges with robust plans serve as ideal locations. Thanks to @k_stephensonMD and her fellow investigators, as well as all the students making this possible.
preventcovidu.org/the-study/
preventcovidu.org/the-study/
• • •
Missing some Tweet in this thread? You can try to
force a refresh


