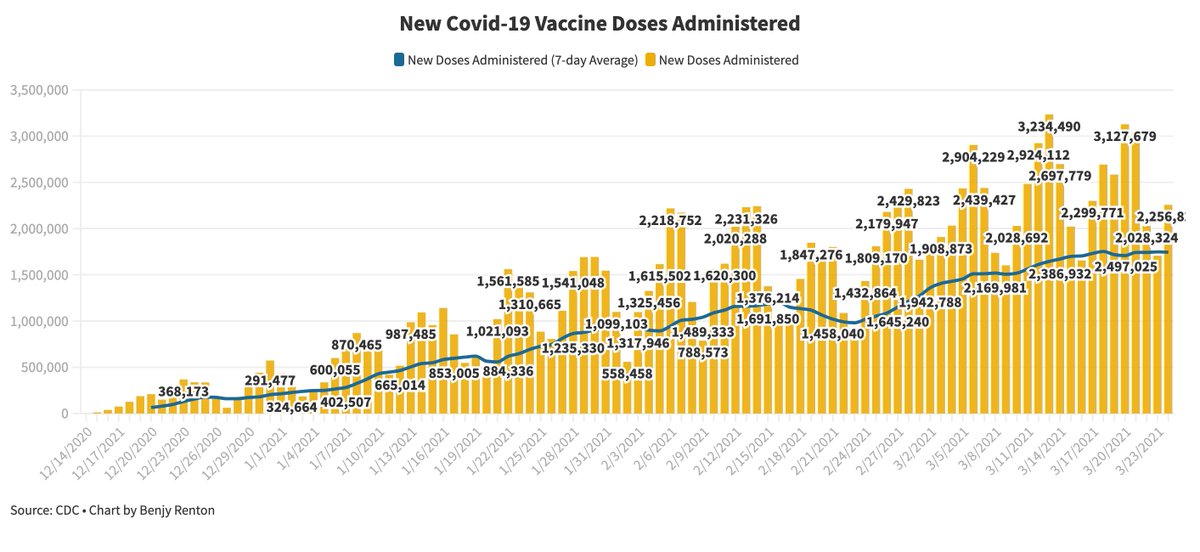
NEW RECORD: 3,379,393 doses have been reported administered in the last 24 hours, the highest reporting day yet.

Doses Delivered: 177,501,775
Doses Administered: 136,684,688
7-day average: 2.62M shots per day (record)
Supply used: 77.0%

public.tableau.com/views/COVID-19…
Wisconsin leads U.S. states with 90.3% of shots used.
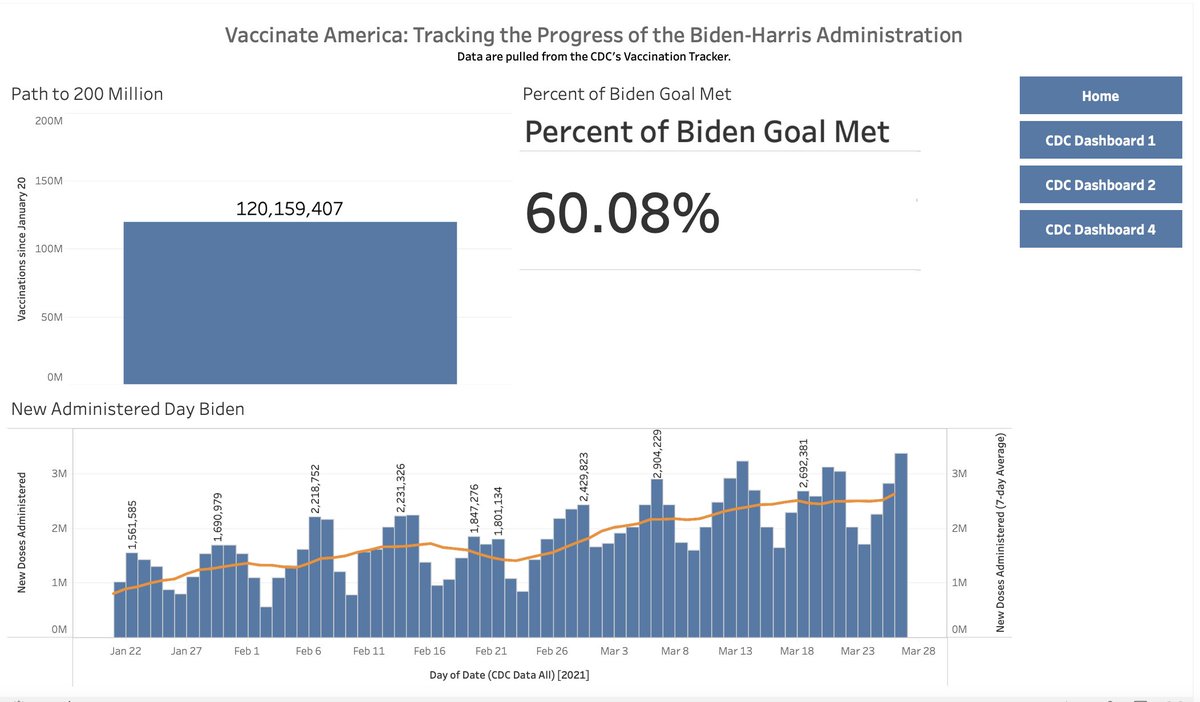
In 65 days, we are 60.08% of the way to President Biden's newly announced goal of 200 million shots in 100 days. #VaccinateAmerica

• • •

Missing some Tweet in this thread? You can try to force a refresh
 

Keep Current with Benjy Renton

Benjy Renton Profile picture

Stay in touch and get notified when new unrolls are available from this author!

Read all threads

This Thread may be Removed Anytime!

PDF

Twitter may remove this content at anytime! Save it as PDF for later use!

Try unrolling a thread yourself!

how to unroll video
  1. Follow @ThreadReaderApp to mention us!

  2. From a Twitter thread mention us with a keyword "unroll"
@threadreaderapp unroll

Practice here first or read more on our help page!

More from @bhrenton

27 Mar
An update on the situation in Michigan, which continues to worsen. The state has the highest confirmed cases per capita of B.1.1.7 in the country and we are seeing rising case counts in Minnesota as well. Test positivity is at 9% in the last week.
Michigan and Minnesota currently have the highest sequenced B.1.1.7 cases per capita, according to the CDC. Curious to see if these trends are related. Image
Over time, sequenced cases in Michigan have risen beyond the national rate. Image
Read 5 tweets
26 Mar
A major study was announced today with 12,000 college students to help understand the impacts of Covid-19 vaccination on further spread and transmission. @lindsayaellis discusses the project here, which is funded by NIAID. Short thread on the study:
chronicle.com/article/when-t…
The study will take place at 21 universities, many large institutions, nationwide. About half of the students will receive the vaccine injections right away, and the other half will receive the vaccine a few months later. The students will each identify “close contacts.”
These close contacts, around 25,000 of them, will also be in the study. Information on specifics was presented in today's White House briefing. The clinical trial record is available here, for those interested in specific endpoints.
clinicaltrials.gov/ct2/show/NCT04…
Read 9 tweets
24 Mar
2,256,824 doses have been reported administered in the last 24 hours. 33% of adults have received at least 1 dose.

Doses Delivered: 169,223,125 (+4.9M)
Doses Administered: 130,473,853
7-day average: 2.49 million shots per day
Supply used: 77.1%

public.tableau.com/views/COVID-19… Image
North Dakota now leads the states with 88.1% of shots used. Image
Next week is the largest week for allocations yet, with over 20 million doses scheduled to be allocated to states.
Read 4 tweets
19 Mar
It ain't over till it's over. While cases throughout much of the country have continued to decline, Michigan has seen an increase in new cases and hospitalizations. This could point to the effects of variants in a largely unvaccinated population. Thread:
covidtracking.com/analysis-updat…
First, let's show how we got here. The increase in cases may be attributed to not only pandemic fatigue, but also policy that opened indoor dining to 25% (February 1) and 50% capacity (March 5). This was after largely successful policy in November.
Enter variants. The B.1.1.7 variant has been increasing in prevalence in Michigan, now estimated to be 60% of cases — higher than Florida, according to Helix data (graphic credit @EricTopol). Michigan may be the bellwether state on this variant.
helix.com/pages/helix-co…
Read 14 tweets
14 Mar
Vaccine data reporting 101:

The CDC pulls numbers from state immunization sites every morning at 6 a.m. (the daily cutoff). It spends the morning verifying these numbers and publishes a public update by 8 p.m. (usually some time in the afternoon).
Today, the CDC reported 2,977,732 doses by the 6 a.m. cutoff (a record regardless) and then had a delay in data syncing, resulting in 4,575,496 new doses administered that were reported. This means tomorrow's numbers will be slightly lower than usual.
As per usual, doses are reported two ways: by the day they are reported (right) and the day they are actually administered (left). The graph on the left is backfilled each day as states report more doses. However, we often use the graph on the right for daily vaccinations.
Read 5 tweets
13 Mar
Earlier this week, Alaska made vaccines available to those 16 and older, becoming the first state to remove eligibility requirements. It leads the nation with 17% of its population fully vaccinated. So what can we learn? And what is it sometimes hard to compare states? A thread:
While Alaska is the first state to remove eligibility requirements, effective immediately, other states are expected to do the same in the coming weeks, and certainly before President Biden's deadline on May 1. We will continue to track these.
washingtonpost.com/health/2021/03…
Vaccination plans are complex and in order to make comparisons among states with metrics such as doses per capita and percentage of the population vaccinated, we must consider:
- Supply
- Delivery
- Uptake
- Population characteristics

Let's analyze Alaska with these factors.
Read 13 tweets

Did Thread Reader help you today?

Support us! We are indie developers!


This site is made by just two indie developers on a laptop doing marketing, support and development! Read more about the story.

Become a Premium Member ($3/month or $30/year) and get exclusive features!

Become Premium

Too expensive? Make a small donation by buying us coffee ($5) or help with server cost ($10)

Donate via Paypal Become our Patreon

Thank you for your support!

Follow Us on Twitter!