It's hard to discuss COVID-19 in Mumbai without sounding alarmist. Because the situation is alarming. Calculations suggest:
- more people are being infected daily in housing societies than ever before
- transmission in slums could be close to the huge speeds of April-May 2020.
🧵
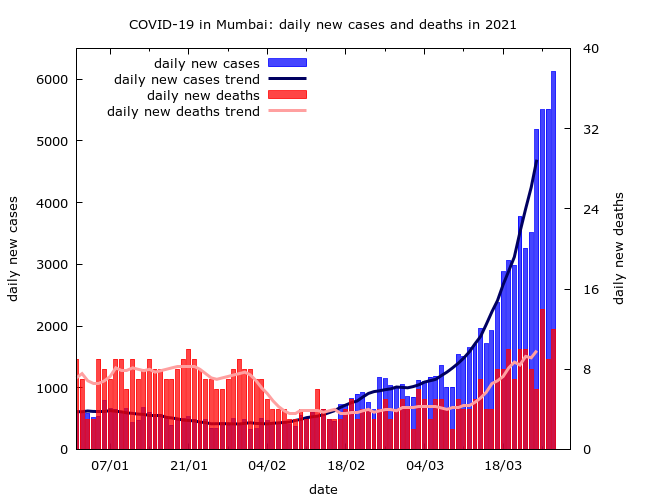
In the last week Mumbai has recorded 43K cases. But this figure is useless if we don't know how many infections are missed. I estimate:

43K cases = more than 7 lakh infections. That's >5% of the city. In one week.

Let's see how. [Notes on the numbers at the end.]
In the last week ~15% of tests returned +ve. (About half were rapid - if all had been more sensitive RT-PCR tests, positivity would be closer to 20%.) We know that as test positivity (TPR) rises, detection drops - the fraction of missed infections rises. Let's track back...
TPR and % of infections detected in slums/nonslum areas:

Upto 8/7/20: TPR=24%, ~0.8% in the slums, ~5.9% in housing societies

8/7/20-31/12/20: TPR=10%, ~2.5% in the slums, ~11% in housing societies

Last week: TPR=15%, ??% in the slums, ??% in housing societies
We don't know current detection. But let's be optimistic and suppose it has remained at the levels estimated for later in 2020: ~2.5% in the slums and 11% in housing societies. This would mean currently ~1 lakh daily transmissions: ~60K in the slums, and ~40K in nonslum areas.
These figures are optimistic: they assume that detection hasn't suffered even though TPR is higher.

For context: 40K daily transmissions in housing societies is much more than ever before. 60K daily transmissions in the slums compares to an estimated >1 lakh at first wave peak.
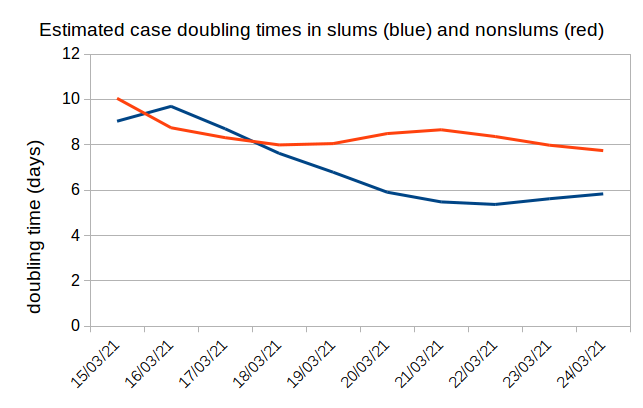
So COVID is really raging in the city - both "halves" of it. If it is any comfort, the rate of rise of new cases seems to have slowed recently. (Doubling time has risen.)

BUT, until test positivity starts to fall, it's too early to read much into this.
Note 1. Estimates of slum/nonslum cases follow a procedure described in this link. This gives about 22% of current cases from the slums. But the difference in detection would imply around 60% of new infections occurring in the slums.
github.com/muradbanaji/Mu…
Note 2. Estimates of detection upto early July are based on the first serosurvey. The calculations are here (maths.mdx.ac.uk/research/model…). They accompanied this piece on Mumbai's second surge:
science.thewire.in/health/mumbai-…
Note 3. Estimates of detection after 8/7/20 use recorded fatalities + a later slum serosurvey. They assume that ~20% of fatalities were from the slums after July 2020. This is consistent with 75% prior infection in the slums by the year end. (I'll put up a doc on this.)

• • •

Missing some Tweet in this thread? You can try to force a refresh
 

Keep Current with Murad Banaji

Murad Banaji Profile picture

Stay in touch and get notified when new unrolls are available from this author!

Read all threads

This Thread may be Removed Anytime!

PDF

Twitter may remove this content at anytime! Save it as PDF for later use!

Try unrolling a thread yourself!

how to unroll video
  1. Follow @ThreadReaderApp to mention us!

  2. From a Twitter thread mention us with a keyword "unroll"
@threadreaderapp unroll

Practice here first or read more on our help page!

More from @muradbanaji

28 Mar
Mumbai #COVID19 update. There has been a sharp rise in testing in Mumbai over the last 4 days. This has stabilised test positivity (weekly averages), but not yet brought it down. About half of the tests are now rapid tests, up from ~30% earlier. (1/6)
Cases and deaths. Cases are doubling roughly every week at the moment (partly, perhaps, about the rise in testing). In the last two weeks deaths have also been rising - doubling roughly every two weeks (the relatively low numbers mean there's a lot of uncertainty). (2/6)
In the past week, the slum epidemic seems to be growing faster - estimated case doubling times have been lower in the slums. This is a worrying trend - we've seen before how a nonslum surge sparks a faster slum surge. (These are estimates based on examining ward-wise data.) (3/6)
Read 6 tweets
26 Mar
#COVID19 in Punjab. Are we seeing effects of widespread circulation of the more lethal "U.K. variant" (B.1.1.7) in Punjab? (thehindu.com/news/national/…).

Yes, I think so. Apparently this variant could be ~64% more deadly (medicalnewstoday.com/articles/covid…).

#thread (1/6)
Fatalities in Punjab seem to lag cases by about 17 days - that's something of an educated guess since there's a lot of noise in the data. Here's the 17-day delayed CFR in Punjab since the start of the year. It is an astonishing picture. What does it show? (2/6) Image
Through January the delayed CFR hovered between 2 and 3. Since late April it's hovered around 5. A *very clear* change. This could be the effect of increased circulation of the more lethal variant. An alternative explanation also needs to be looked at... (3/6)
Read 6 tweets
22 Mar
Data from Mumbai's latest COVID-19 wave is suggesting that reinfections are important and/or a more transmissible variant is circulating. Here's why. (A slightly technical thread, assumptions and possible objections at the end.) (1/n)
First, the argument in brief: current spread is just too fast. The speed is at odds with levels of prior infection in the city and what we know about R0 - the basic reproduction number in the city - based on the earliest availale data.
The current doubling time for daily cases (weekly average) is ~8 days. With TPR also rising sharply, the true doubling time for infections may be shorter. With standard assumptions, we get R = ~1.57. Estimated cases from slums and nonslums give roughly the same R value in both.
Read 16 tweets
15 Mar
(1/4) Brief 🧵on Mumbai's all cause mortality and COVID-19 infection fatality rate (IFR). 2020 data shows a huge 24% rise in mortality over the previous 5 year average. That's about 22K extra deaths in 2020. Of these about 11K were recorded COVID deaths.
portal.mcgm.gov.in/irj/portal/ano…
(2/4) We don't know exactly how many 2020 excess deaths were COVID deaths. These could range from the official 11K up to more than 22K, since there's evidence some kinds of mortality fell in 2020. Let's say COVID deaths in 2020 were between 11K and 24K.
(3/4) We don't know exactly how many infections occurred in 2020, but based on seroprevalence data and modelling, somewhere between 6.5M to 9M infections occurred in the city. That's between 50% and 70% of the population (~12.9M), if we assume reinfections were rare.
Read 4 tweets
23 Feb
This thread is troubling. Yes, India's data is interesting - let's acknowledge the complexities and uncertainties, but based on evidence and without wild claims. #thread
First of all, the premise of the thread - comparing recorded cases and deaths across countries is meaningless without acknowledging differences in surveillance. There's enough seroprevalence data to go beyond "cases"...
From the latest Indian survey, about 3.5% of infections have been detected (science.thewire.in/health/third-n…).

In the US, it's over 20% (cidrap.umn.edu/news-perspecti…).

So an India-US comparison of cases per million is highly misleading.
Read 20 tweets
6 Feb
For this piece, I tried to gather together some thoughts about the serosurvey data coming out of India. There is a great deal of this data, and the messages are important but not always clear. Longish #thread. 1/n
scroll.in/article/986097…
First, to see the bogus narratives you can construct when you ignore serosurvey data, you just have to look at Chapter 1 of the recent "Economic Survey". (This thread took just one example, but there are many.)
Key message from the serosurveys? Extremely variable surveillance of infections *and probably deaths*. In some places, a decent proportion of infections are picked up; in others a tiny fraction. Some areas have seen a huge number of infections, but almost no recorded deaths.
Read 16 tweets

Did Thread Reader help you today?

Support us! We are indie developers!


This site is made by just two indie developers on a laptop doing marketing, support and development! Read more about the story.

Become a Premium Member ($3/month or $30/year) and get exclusive features!

Become Premium

Too expensive? Make a small donation by buying us coffee ($5) or help with server cost ($10)

Donate via Paypal Become our Patreon

Thank you for your support!

Follow Us on Twitter!