When commenting for this piece by @soutikBBC, here are some things I noticed.
(1/4) Almost all regions are showing rapid exponential growth in cases at the same time.
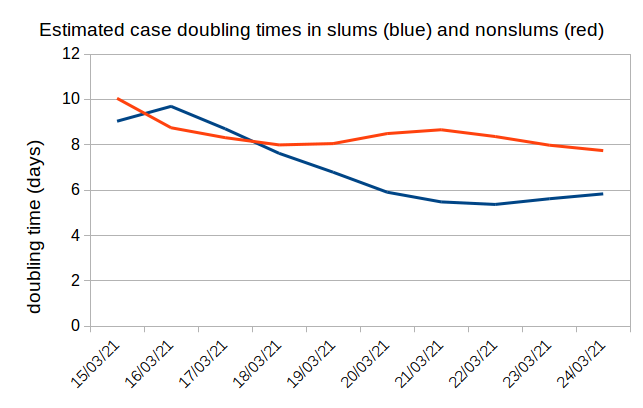
(2/4) Places badly hit earlier (sometimes more than once) are being badly hit again.
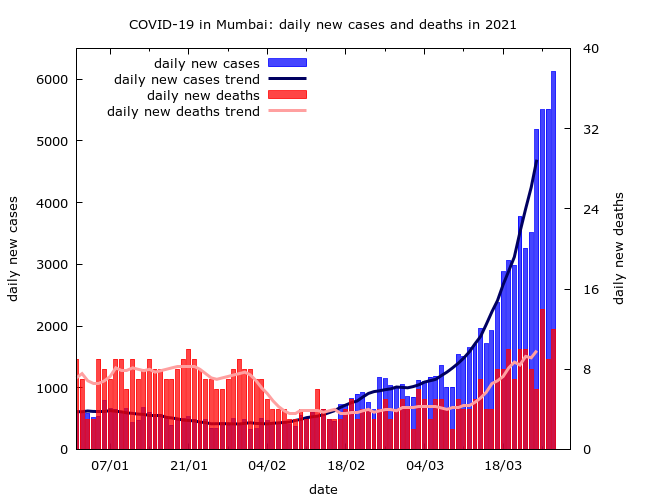
(3/4) At the moment, there is no reason to believe that deaths are rising more slowly than expected from the rise in cases- when you take delays into account. Optimism is good, but not misplaced optimism.
(4/4) In districtwise data from @covid19indiaorg you often see the great majority of districts in a state surging together. This is clearest in log plots of recent data: Andhra Pradesh, Maharashtra, Gujarat and Punjab shown. (4 more districts in the next tweet.)
(4/4) Districtwise data from Madhya Pradesh, Karnataka, Haryana and Uttar Pradesh.
I think knowing where this second surge is going will take some time. True, there is more experience now & vaccination. But also fatigue at restrictions, and the need to earn a living.
• • •
Missing some Tweet in this thread? You can try to
force a refresh
It's hard to discuss COVID-19 in Mumbai without sounding alarmist. Because the situation is alarming. Calculations suggest:
- more people are being infected daily in housing societies than ever before
- transmission in slums could be close to the huge speeds of April-May 2020.
🧵
In the last week Mumbai has recorded 43K cases. But this figure is useless if we don't know how many infections are missed. I estimate:
43K cases = more than 7 lakh infections. That's >5% of the city. In one week.
Let's see how. [Notes on the numbers at the end.]
In the last week ~15% of tests returned +ve. (About half were rapid - if all had been more sensitive RT-PCR tests, positivity would be closer to 20%.) We know that as test positivity (TPR) rises, detection drops - the fraction of missed infections rises. Let's track back...
Mumbai #COVID19 update. There has been a sharp rise in testing in Mumbai over the last 4 days. This has stabilised test positivity (weekly averages), but not yet brought it down. About half of the tests are now rapid tests, up from ~30% earlier. (1/6)
Cases and deaths. Cases are doubling roughly every week at the moment (partly, perhaps, about the rise in testing). In the last two weeks deaths have also been rising - doubling roughly every two weeks (the relatively low numbers mean there's a lot of uncertainty). (2/6)
In the past week, the slum epidemic seems to be growing faster - estimated case doubling times have been lower in the slums. This is a worrying trend - we've seen before how a nonslum surge sparks a faster slum surge. (These are estimates based on examining ward-wise data.) (3/6)
#COVID19 in Punjab. Are we seeing effects of widespread circulation of the more lethal "U.K. variant" (B.1.1.7) in Punjab? (thehindu.com/news/national/…).
Fatalities in Punjab seem to lag cases by about 17 days - that's something of an educated guess since there's a lot of noise in the data. Here's the 17-day delayed CFR in Punjab since the start of the year. It is an astonishing picture. What does it show? (2/6)
Through January the delayed CFR hovered between 2 and 3. Since late April it's hovered around 5. A *very clear* change. This could be the effect of increased circulation of the more lethal variant. An alternative explanation also needs to be looked at... (3/6)
Data from Mumbai's latest COVID-19 wave is suggesting that reinfections are important and/or a more transmissible variant is circulating. Here's why. (A slightly technical thread, assumptions and possible objections at the end.) (1/n)
First, the argument in brief: current spread is just too fast. The speed is at odds with levels of prior infection in the city and what we know about R0 - the basic reproduction number in the city - based on the earliest availale data.
The current doubling time for daily cases (weekly average) is ~8 days. With TPR also rising sharply, the true doubling time for infections may be shorter. With standard assumptions, we get R = ~1.57. Estimated cases from slums and nonslums give roughly the same R value in both.
(1/4) Brief 🧵on Mumbai's all cause mortality and COVID-19 infection fatality rate (IFR). 2020 data shows a huge 24% rise in mortality over the previous 5 year average. That's about 22K extra deaths in 2020. Of these about 11K were recorded COVID deaths. portal.mcgm.gov.in/irj/portal/ano…
(2/4) We don't know exactly how many 2020 excess deaths were COVID deaths. These could range from the official 11K up to more than 22K, since there's evidence some kinds of mortality fell in 2020. Let's say COVID deaths in 2020 were between 11K and 24K.
(3/4) We don't know exactly how many infections occurred in 2020, but based on seroprevalence data and modelling, somewhere between 6.5M to 9M infections occurred in the city. That's between 50% and 70% of the population (~12.9M), if we assume reinfections were rare.
This thread is troubling. Yes, India's data is interesting - let's acknowledge the complexities and uncertainties, but based on evidence and without wild claims. #thread
First of all, the premise of the thread - comparing recorded cases and deaths across countries is meaningless without acknowledging differences in surveillance. There's enough seroprevalence data to go beyond "cases"...