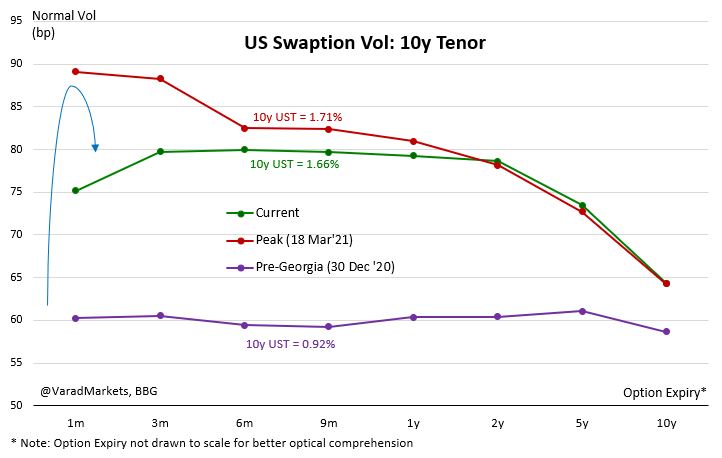
US Swaption/Rates Vol off highs but still elevated

Reasons:
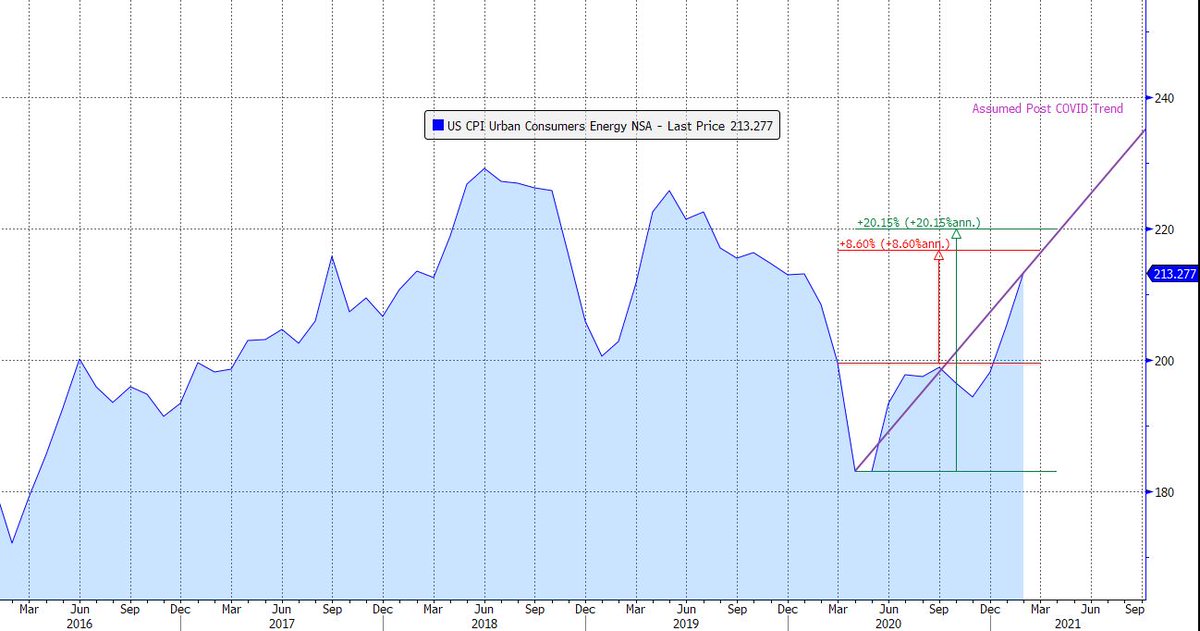
▪️ Economic data ahead; CPI tom; Fed data dependent
▪️ UST supply, 3y 10y 30y auctions this wk
▪️ US ylds, off highs, still close to higher end => risk premium in vols
▪️ Market v/s Fed disconnect on Rate Hike

1/4
▪️ SEP-based June FOMC important => till then would have got two more NFPs & Inflation data till May incorporating Apr/May base effect + stimulus based spikes => little kink around 3m in vol curve
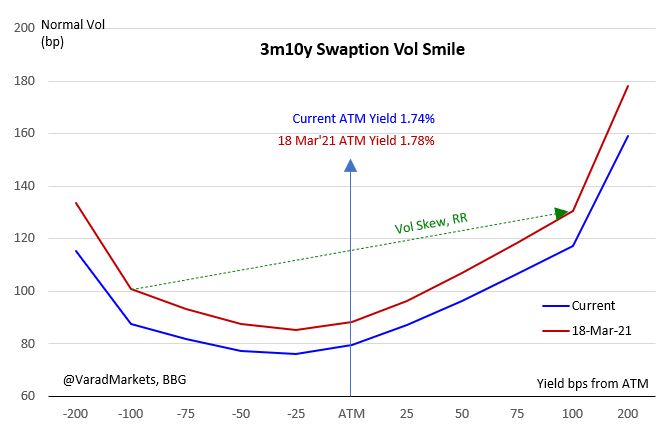
▪️ Vol Skew mildly softer but still topside nervousness (convexity hedging)

2/4
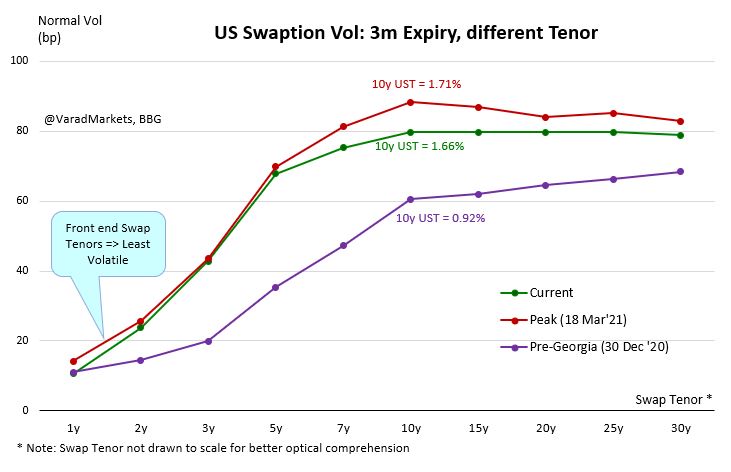
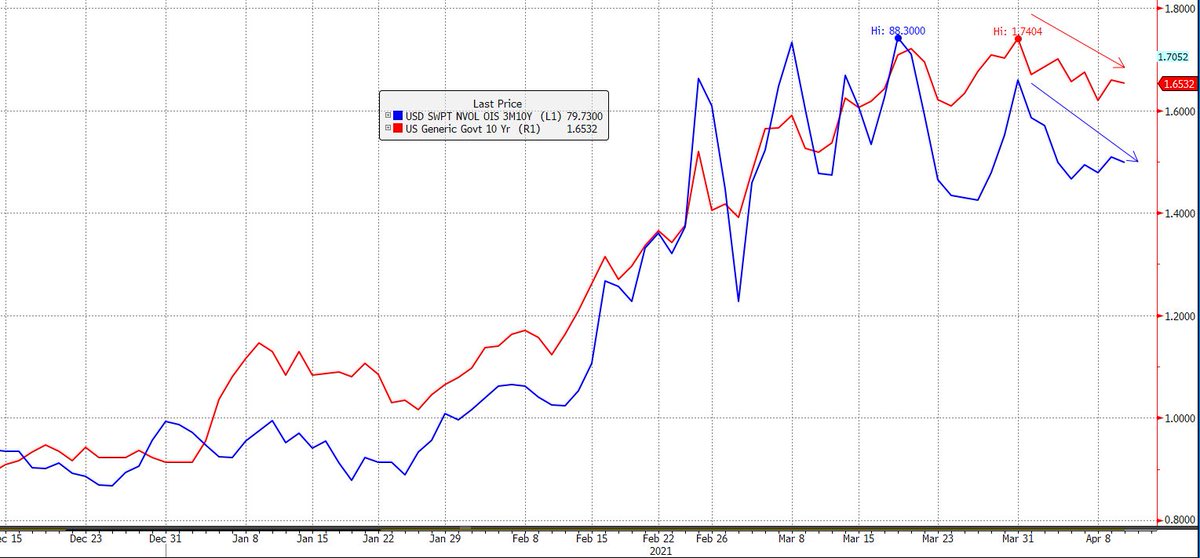
▪️ Chart: 3m Expiry Vol across Swap Tenors => Front end swap tenors least volatile as anchored by Fed Fund/OIS/T-Bill yields

▪️ Chart: 3m10y Swaption Vol v/s 10yr US Yield: higher yield => higher vol as reflected in Vol Skew

3/4
@bondstrategist
Basic Swaption recap:
▪️ Option on USD Interest Rate Swap (IRS); Call (Payer); Put (Receiver)
▪️ Two time horizons:
1⃣ Tenor of underlying swap
2⃣ Maturity/expiry of option
▪️ Vol Cube => Vol across Strike vs Tenor vs Maturity
▪️ 3m10y => 3m Expiry Option on 10yr USD IRS

• • •

Missing some Tweet in this thread? You can try to force a refresh
 

Keep Current with Varad Markets

Varad Markets Profile picture

Stay in touch and get notified when new unrolls are available from this author!

Read all threads

This Thread may be Removed Anytime!

PDF

Twitter may remove this content at anytime! Save it as PDF for later use!

Try unrolling a thread yourself!

how to unroll video
  1. Follow @ThreadReaderApp to mention us!

  2. From a Twitter thread mention us with a keyword "unroll"
@threadreaderapp unroll

Practice here first or read more on our help page!

More from @VaradMarkets

12 Apr
#US #CPI March #Inflation tomorrow:

🚩Headline Exp 2.5% (vs 1.7% Feb)
🚩Core Exp 1.5% (vs 1.3% Feb)

▪️ That +1.0% gap would be largest Headline v/s Core CPI gap since 2011 on huge Energy driven base effects; 5yr avrg gap -0.20%, 2yr avrg -0.37%

1/4 Image
▪️ Chart: Energy Inflation indeed so volatile
▪️ Food Inflation key contributor since COVID - likely to ease off marginally on base effects
▪️ Energy base effect => massive spike to Headline over Apr/May => Headline vs Core likely to diverge further

@chigrl
2/4 Image
▪️ Energy Inflation, negative recently, was +2.4% Feb, could jump to as high as +8.5% yoy in Mar & +20% in April
▪️ Energy Index collapsed Apr/May'20 but Food Index jumped => opposite base effects

3/4
ImageImage
Read 4 tweets
8 Apr
India #RBI formally launches #QE:

▪️ Named 'Government Securities Acquisition Programme', G-SAP 1.0
▪️ Commits to specific amt of G-Sec purchases (INR 1.0 trn in Q1 FY2021-22)
▪️ At annualized INR 4 trn, that is ~7% of RBI Balance Sheet BS (Fed's $1.44 trn QE => ~19% BS)

1/5
G-SAP = YCC?
▪️ While RBI prefers 10yr yield to be ard 6.0%, formal Yield Curve Control YCC targets specific yld for specific tenor (BOJ Japan & RBA Australia) => unknown amt of bond purchase to meet yld target
▪️ RBI's G-SAP more QE (pre-announced amt) than YCC

@dugalira
2/5
G-SAP v/s OMO?
▪️ Practically not much diff but RBI generally does not commit to purchase amt under OMO
▪️ OMO more for liquidity mgmt => inject as well as absorb liquidity
▪️ QE purchase necessarily injects liquidity; targets backend ylds => BS expansion => Reserve Money ⬆️

3/5
Read 5 tweets
16 Feb
Trading #US $Dollar: Basic Macro Construct

Two key Dollar drivers:

#1 Growth/Inflation/Risk-sentiment (y-axis)=> Inflation Breakeven (BE) (/ Equities)

#2 Nominal Interest Rates (x-axis) => 10yr US Treasury Yield

1/10
Q=Quadrant

Q1: Risk-On-Lower Real Rates => Short USD
Q1: Risk-On-Higher Real Rates => Long USD
Q2: Goldilocks => Risk-On-Lower Nominal/Real => Short USD
Q3: Risk Off => Lower Rates => Equity Sell off/Bond Rally => Long USD
Q4: Risk Off => Equity & Bond Sell off => Long USD

2/10
Performance since COVID, Mar'20
Q1:
- Higher BE/Risk On + Higher Nominals => 31% of all observations
- Good success (85%) on Short USD under lower Real (18.4% of obs)
- But higher Real under Risk On only 20% success on Long USD
- So despite higher Real, USD lower on Risk On
3/10
Read 10 tweets
6 Feb
#DiveIn: #Inflation Breakevens (BE)

Given immense focus on fiscal, monetary & inflation dynamics, quick brush up on Inflation BE:

BE = Nominal Rate, N (US Treasury Yield) – Real Rate, R (US Treasury Inflation Protected Securities, #TIPS Yields, T)

1/8
BE = inflation level that makes investor indifferent b/w buying UST or TIPS
= (approx) market-based measure of risk neutral inflation expectations
= TIPS indexed to non-seasonally adjusted #CPI

10y BE = (10y Nominal Treasury yld) - (10y TIPS yld) = 1.16% - (-1.04%) = +2.20%

2/8
Breakevens (from TIPS) actually do not capture pure inflation expectations

Nominal N = Short end Real + Term Premium + Inflation Expectation IE + Inflation Risk Premium IRP

TIPS Real R = Short end Real + Term Premium + Liquidity Premium LP

BE = N – R = IE + IRP – LP <> IE

3/8
Read 8 tweets

Did Thread Reader help you today?

Support us! We are indie developers!


This site is made by just two indie developers on a laptop doing marketing, support and development! Read more about the story.

Become a Premium Member ($3/month or $30/year) and get exclusive features!

Become Premium

Too expensive? Make a small donation by buying us coffee ($5) or help with server cost ($10)

Donate via Paypal Become our Patreon

Thank you for your support!

Follow Us on Twitter!