1. This is a thread about the barriers to academic publication for work that challenges the ‘official narrative’ on Covid-19 such as our work challenging the 'official' data about asymptomatics.
2. Our paper about the “1 in 3 people with Covid-19 have no symptoms” claim has already had 4093 reads since posted on researchgate on Friday, and 337,255 impressions to the tweet about it. The video summary has been watched by 7,530 people in 2 days. doi.org/10.13140/RG.2.…
3. But, this was the response we got less than 24 hours after we submitted it to the BMJ:
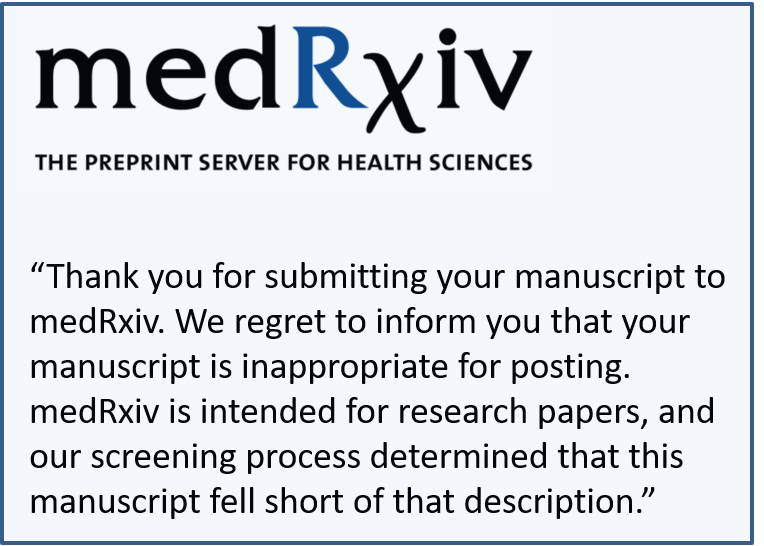
4. Even more bizarrely, neither the medRxiv or arXiv sites (where we routinely post pre-prints of our research) would accept the paper. Here is the MedRxiv response:
5. while arXiv (which said: “Your article is currently scheduled to be announced at Fri, 9 Apr 2021 00:00:00 GMT”) then quitely changed the status of the article to “on hold” as the submission “was identified by arXiv administrators or moderators as needing further attention.”
6. Now compare this with what happened in April 2020 when we first investigated Covid-19 data. Whereas our latest work shows that 'case' numbers have been exaggerated and that mass testing of asymptomatic people is counter-productive, at that time we were actually concerned that
7. a) the numbers infected were being UNDERESTIMATED and
b) the data was being skewed by the fact that ONLY people with extreme Covid symptoms were being tested (and hence we argued for the need for more random testing).
8. These views were not considered threatening to the "official narrative" and of course random testing WAS widely implemented after August. We had no problem getting those articles published in academic journals e.g: tandfonline.com/doi/full/10.10…
9. But things are completely different when you challenge the "official narrative". Given that even researchgate has been censoring such articles narrative it is possible that our latest paper may be removed.
10. Here is a blog post with all the relevant information and links
probabilityandlaw.blogspot.com/2021/04/the-ba…
11. UPDATE: shortly after writing this tweet we got the following response from arXiv (note the paper which is 'not of sufficient interest' now has 4,206 reads on researchgate, 8,286 youtube views and 341,235 impressions on twitter)

• • •

Missing some Tweet in this thread? You can try to force a refresh
 

Keep Current with Prof Norman Fenton

Prof Norman Fenton Profile picture

Stay in touch and get notified when new unrolls are available from this author!

Read all threads

This Thread may be Removed Anytime!

PDF

Twitter may remove this content at anytime! Save it as PDF for later use!

Try unrolling a thread yourself!

how to unroll video
  1. Follow @ThreadReaderApp to mention us!

  2. From a Twitter thread mention us with a keyword "unroll"
@threadreaderapp unroll

Practice here first or read more on our help page!

More from @profnfenton

9 Apr
1. This 6 minute video summarises the findings in our new report exposing the "1 in 3 people with Covid-19 have no symptoms" claim:
2. The full report is here:
doi.org/10.13140/RG.2.…
3. And here is a blog post containing a summary of the report: probabilityandlaw.blogspot.com/2021/04/smashi…
Read 7 tweets
23 Mar
1. Here is an up-to-date table of results from the Cambridge University #Covid19UK study of asymptomatics since the start of 2021
2. Some key points about it:
3. The explanation of why this means the much repeated Government claim that “1 in 3 people with the virus has no symptoms” is a massive exaggeration was provided in this previous analysis of the Cambridge study: probabilityandlaw.blogspot.com/2021/02/the-ca…
Read 6 tweets
14 Mar
1. This article nicely explains why (because of possible false positives) a positive LFT test result does NOT mean you certainly have Covid. However, it's focus on false negatives (implying we should also be wary of a negative result) is misleading. theguardian.com/theobserver/co…
2. In fact, with the assumptions used in the article and the current results of the Cambridge University study of asymptomatics, it follows that there's ony a 1 in 10,000 chance a person testing negative with LFT will have the virus
3. The results suggest we should NOT be mass testing asymptomatic people. The lastest Cambridge asymptomatic study results are here: cam.ac.uk/sites/www.cam.…
Read 6 tweets
28 Feb
1. As I pointed out yesterday with this graphic (now updated) the Cambridge study data shows that since December only a miniscule percentage of people without COVID-like symptoms have the virus. But it also exposes massive contradications in the official Government data.
2. First it demonstrates (for one UK city) that the much publicised claim that "1 in 3 people with the virus has no symptoms" cannot be correct if the ONS estimated infection rate is correct. Here's an informal explanation (formal proof follows later in thread)
3. In fact, if the "1 in 3" claim is correct then the ONS estimated infection rate is massively inflated - the currently reported ‘case’ numbers must be at least 8 times greater than the true number of cases.
Read 16 tweets
27 Feb
This has interesting implications for the accuracy of the official #Covid19UK 'case' data and the claim that it is critical to test people even if they don't have any COVID-19 symptoms. No fancy analysis here. Just the raw data from the Cambridge University study of asymptomics
aysomptomatics (not asymptomics!!!). All the relevant links here: probabilityandlaw.blogspot.com/2021/02/the-ca…
This report says 9,480 of 2,372,358 lateral flow tests in UK 28 Jan - 3 Feb were positive. Given false pos rate for these tests that's about 1 in 1587 true positives. In same period ONS estimated UK infection rate was 1 in 77. gov.uk/government/pub…
Read 6 tweets
18 Dec 20
1/3. The UK #COVID19 testing data since September by different regions reveals a very close correlation between number of people tested and the proportion who test positive (i.e. the positivity rate)....
2/3 ...not clear what if any causal explanation there is to such a close correlation. But indications are that an increasing positivity rate may not be due to an increase in underlying infection rate... A full discussion is here .. probabilityandlaw.blogspot.com/2020/12/uk-cov…
3/3 ... and lockdown decisions could result purely from decisions to increase testing. All the usual caveats apply (and in this case this analysis has been done in a hurry to get it out, as the results seem so unusual and could not be seen from looking at the overall UK data)
Read 5 tweets

Did Thread Reader help you today?

Support us! We are indie developers!


This site is made by just two indie developers on a laptop doing marketing, support and development! Read more about the story.

Become a Premium Member ($3/month or $30/year) and get exclusive features!

Become Premium

Too expensive? Make a small donation by buying us coffee ($5) or help with server cost ($10)

Donate via Paypal Become our Patreon

Thank you for your support!

Follow Us on Twitter!