Herd Immunity.
I've built a model to show the concept of herd immunity.
It shows why we need to not leave hard-to-reach parts of the population unvaccinated.
A thread.
I've built a model to show the concept of herd immunity.
It shows why we need to not leave hard-to-reach parts of the population unvaccinated.
A thread.
Herd immunity, also called population immunity, is the protection for the population that comes from when a proportion have been vaccinated.
With more vaccinations, we move towards this herd immunity threshold.
(We're not there yet, even though some say we are.)
With more vaccinations, we move towards this herd immunity threshold.
(We're not there yet, even though some say we are.)
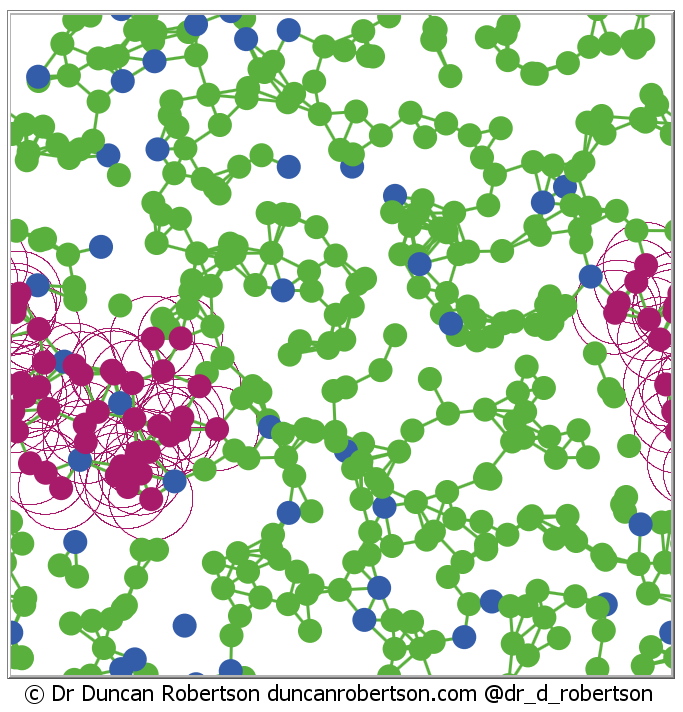
Here's my model. Imagine a population in a country.
People are either susceptible (they may not be vaccinated or have had the virus). We colour these green.
People may have had the vaccine. These are blue.
And there's one (near the bottom left in purple) that is infectious
People are either susceptible (they may not be vaccinated or have had the virus). We colour these green.
People may have had the vaccine. These are blue.
And there's one (near the bottom left in purple) that is infectious
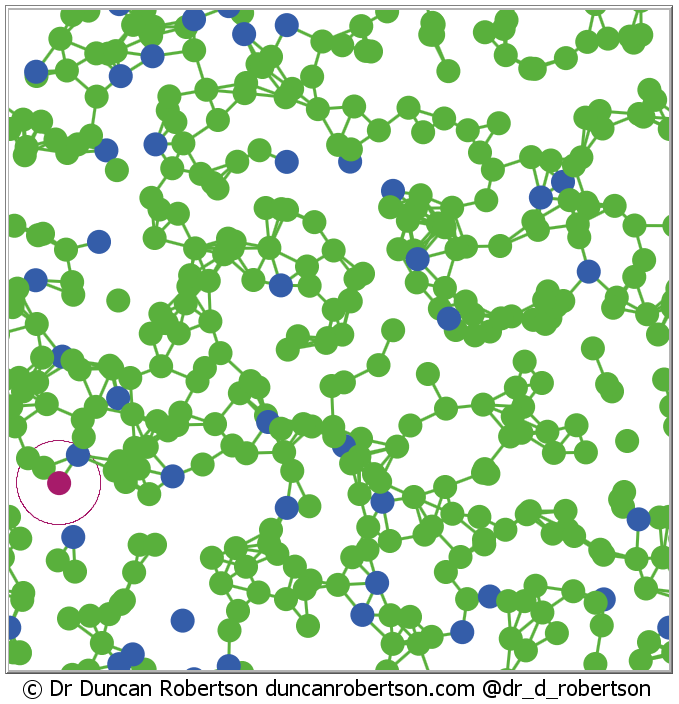
Now, in my model, they will infect anyone who is susceptible (green) within that little circle surrounding them. And those will infect people surrounding *them* 
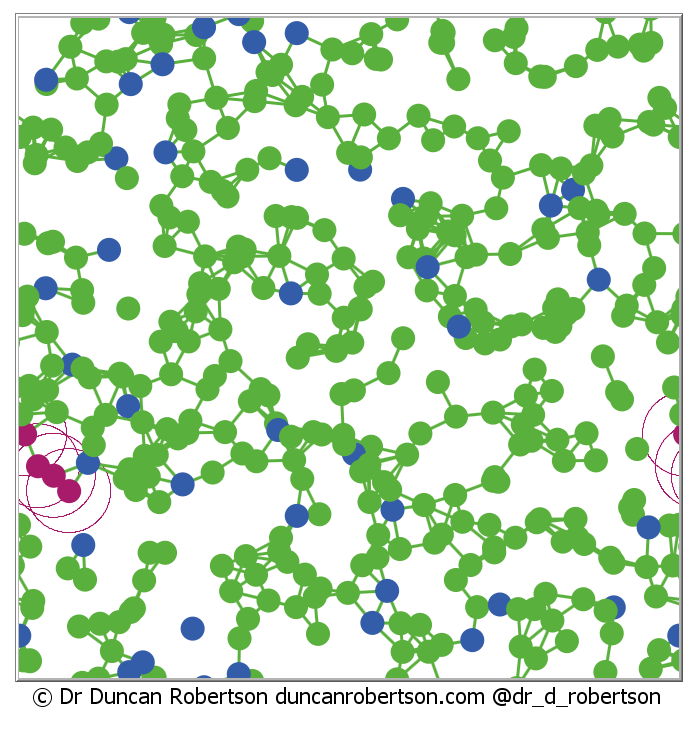
Eventually, almost all (although not all - some are fortunate) are infected.
That's bad. And it's because we haven't reached the herd immunity threshold.
That's bad. And it's because we haven't reached the herd immunity threshold.
So - what happens when we reach the herd immunity threshold (or get close to it)?
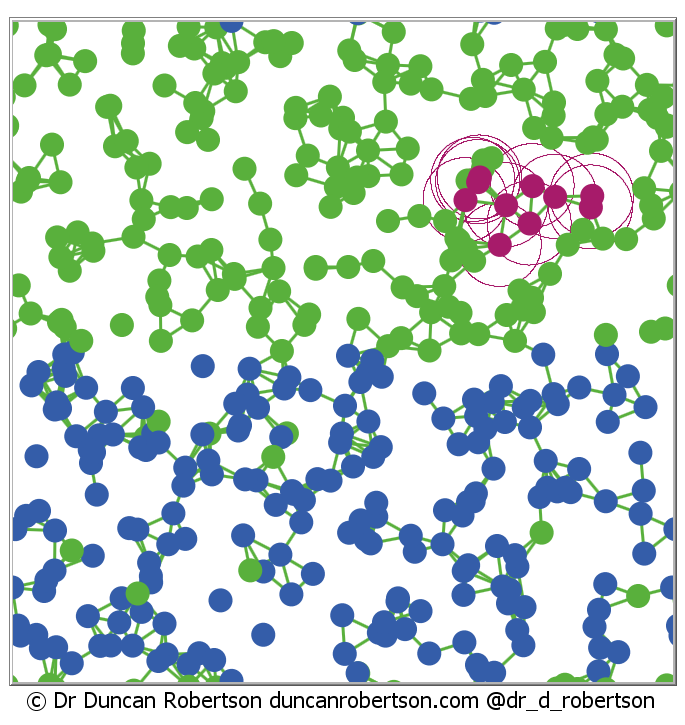
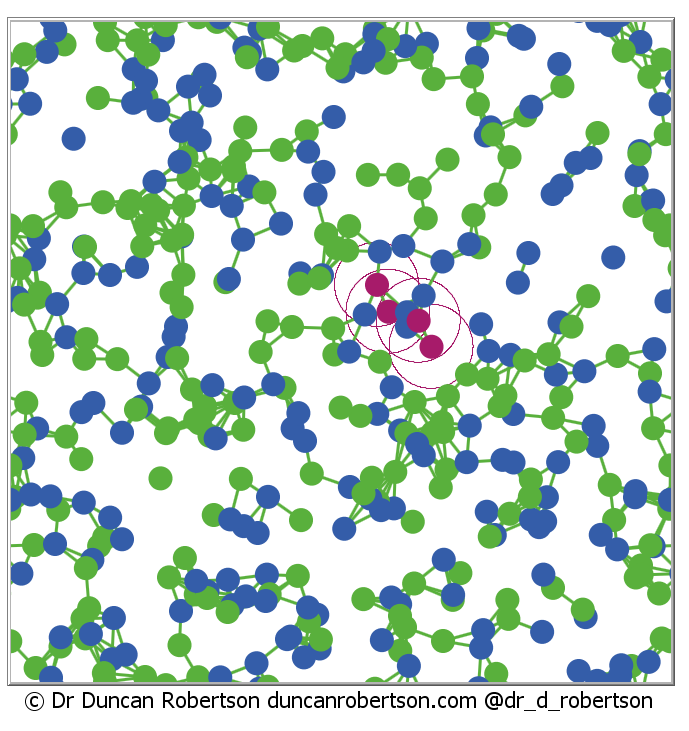
We have many more vaccinated (they're blue).
Let's see what happens when the infectious person (this time in the middle) infects others.
We have many more vaccinated (they're blue).
Let's see what happens when the infectious person (this time in the middle) infects others.
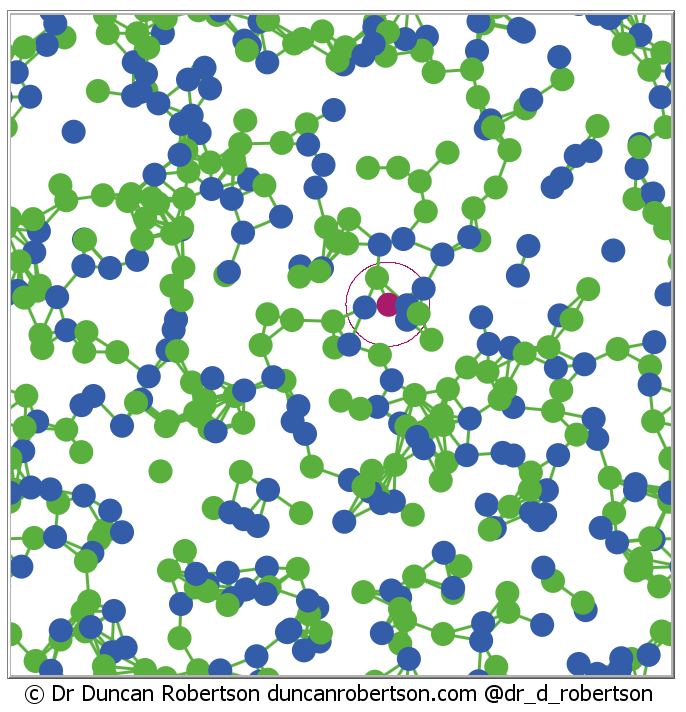
Well, in this case, there's a local infection, but the infection can't be sustained (that's good). Herd immunity. 
But.
What happens when those vaccines are not spread out equally across the country?
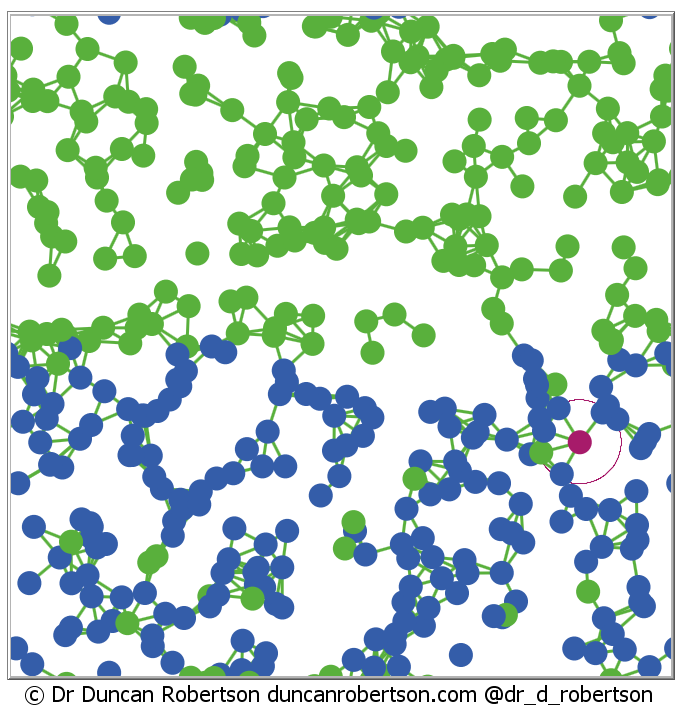
Let's vaccinate *the same number of people* just in the bottom half of our population.
There we are - lots of vaccinated people in blue. That infection (right middle) doesn't stand a chance.
What happens when those vaccines are not spread out equally across the country?
Let's vaccinate *the same number of people* just in the bottom half of our population.
There we are - lots of vaccinated people in blue. That infection (right middle) doesn't stand a chance.
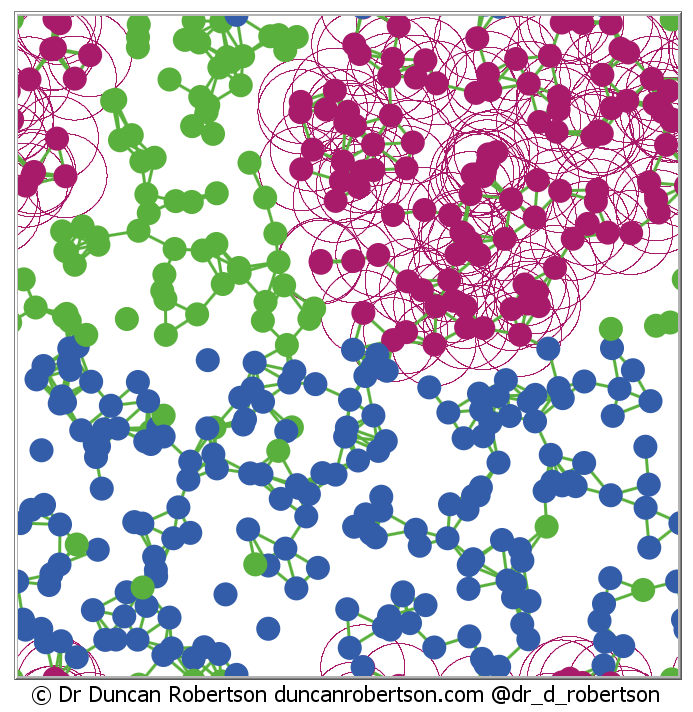
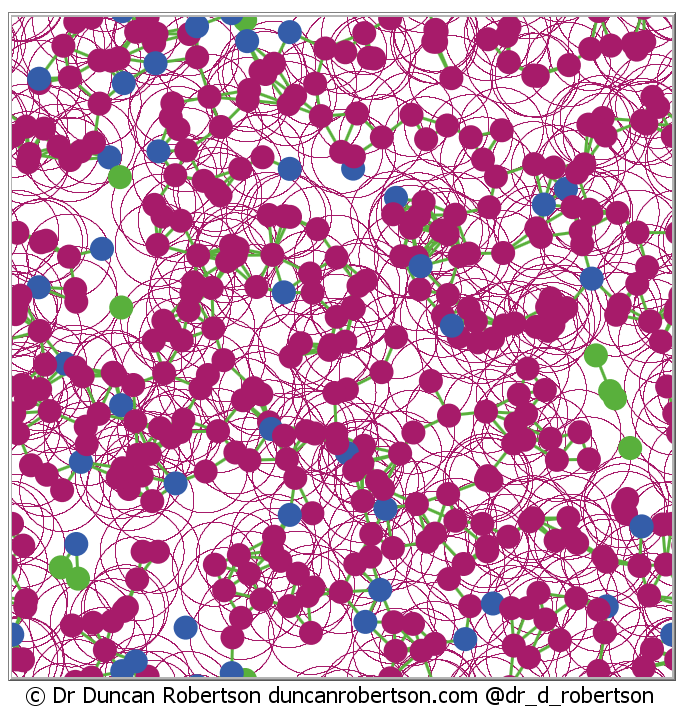
Now let's see what happens when that infectious person is in the top half among the unvaccinated population (remember, we have the same number of vaccinated people in the population as a whole). 
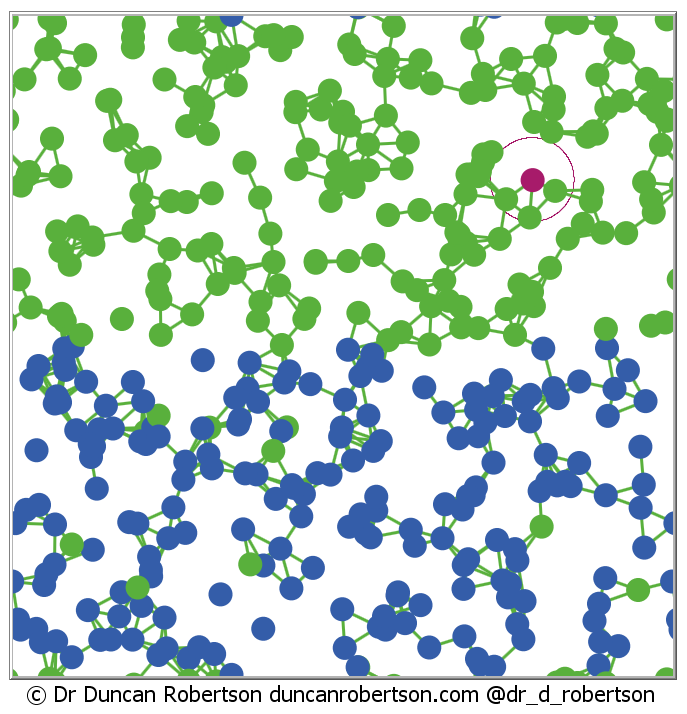
... and spreads ...
... and spreads ...
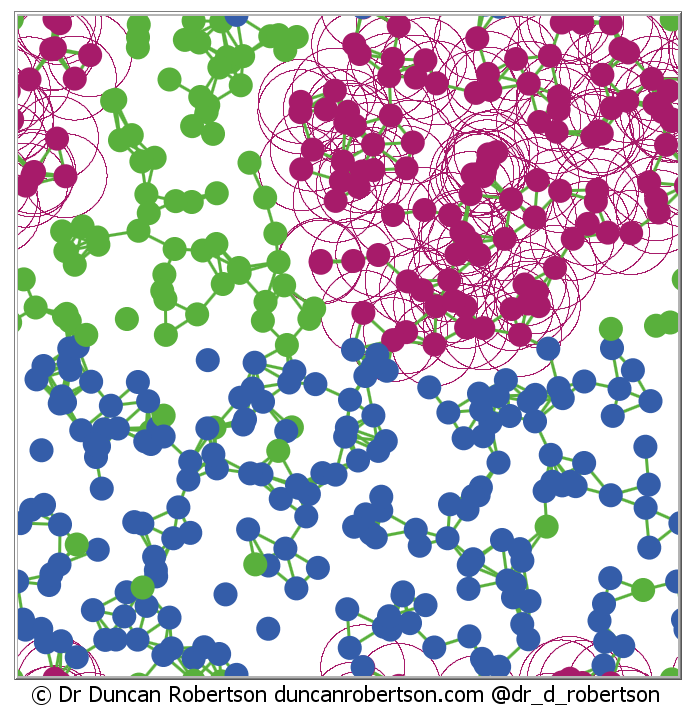
until huge numbers of people are infected *even though we have overall reached the herd immunity threshold*
And that is why we need to vaccinate evenly, not leaving pockets where infection can spread.
... and spreads ...
until huge numbers of people are infected *even though we have overall reached the herd immunity threshold*
And that is why we need to vaccinate evenly, not leaving pockets where infection can spread.
If anyone would like to work with me on this, do let me know. I've built the agent-based model and would be happy to work with others turning it into a paper.
@chrischirp @AdamJKucharski @GrahamMedley
@chrischirp @AdamJKucharski @GrahamMedley
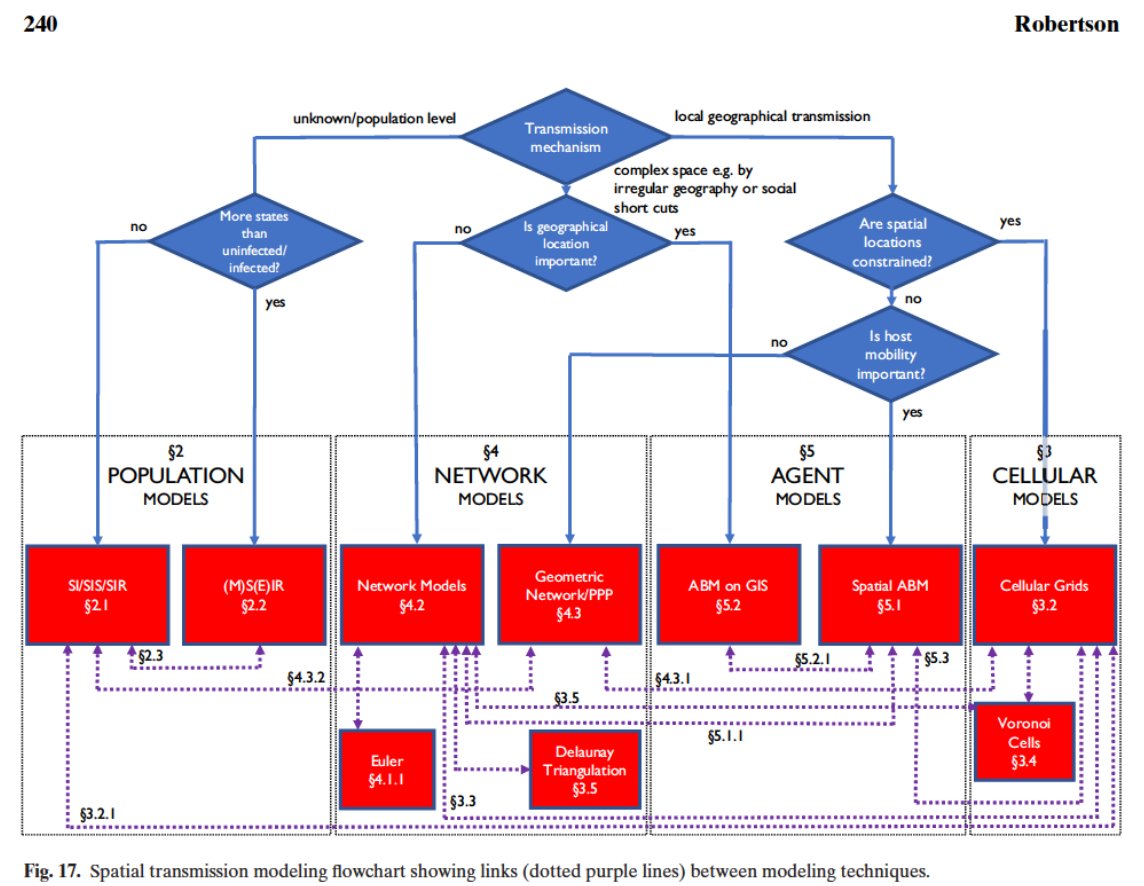
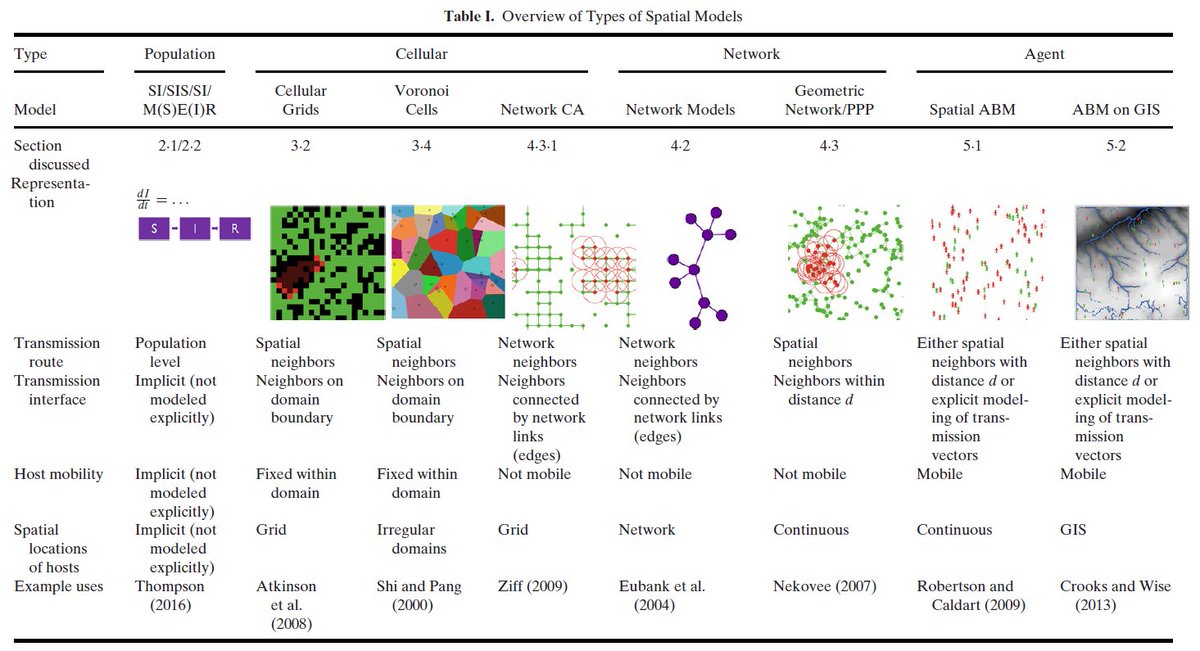
If anyone is interested in the seemingly different ways we can model spatial transmission, here's a paper I wrote pre-Covid showing the similarities between the different approaches of:
- population
- network
- agent-based
- cellular
models
Download here: duncanrobertson.com/research/Risk_…

- population
- network
- agent-based
- cellular
models
Download here: duncanrobertson.com/research/Risk_…
• • •
Missing some Tweet in this thread? You can try to
force a refresh
