Virus, vaccines, and variants. My heatmaps for cases, positivity, hospitalizations, ICU admissions in England.
New this week - charts for vaccine takeup and variants.
Vaccines - good; variants - concerning. We need to ensure that we use the data before unlocking further.

New this week - charts for vaccine takeup and variants.
Vaccines - good; variants - concerning. We need to ensure that we use the data before unlocking further.


All charts this week start from the start of the vaccine rollout and show the (very severe) third wave.
Detected cases.
Increasing in 10-19 year olds (likely due to lateral flow testing in schools).
Increasing in 5-9 year olds. These are not routinely given lateral flow tests.
Other ages - rates decreasing.
Increasing in 10-19 year olds (likely due to lateral flow testing in schools).
Increasing in 5-9 year olds. These are not routinely given lateral flow tests.
Other ages - rates decreasing.

Positivity - Males & Positivity - Females
Reductions except slight rise in 10-19 year olds.
There is low positivity in 10-19s due to mass lateral flow testing.

Reductions except slight rise in 10-19 year olds.
There is low positivity in 10-19s due to mass lateral flow testing.


ICU/HDU Admissions
Very encouraging decreases in most age groups.
65-74 ICU/HDU admissions have increased this week.
Very encouraging decreases in most age groups.
65-74 ICU/HDU admissions have increased this week.

New Heatmap: Vaccine Takeup
Excellent takeup (first doses) for 70+.
Note however that there remain several hundred thousand unvaccinated over 70s who may be vulnerable.
Totals increasing for under-70s.
Totals: 39% given first doses; 3% given second doses.
Excellent takeup (first doses) for 70+.
Note however that there remain several hundred thousand unvaccinated over 70s who may be vulnerable.
Totals increasing for under-70s.
Totals: 39% given first doses; 3% given second doses.

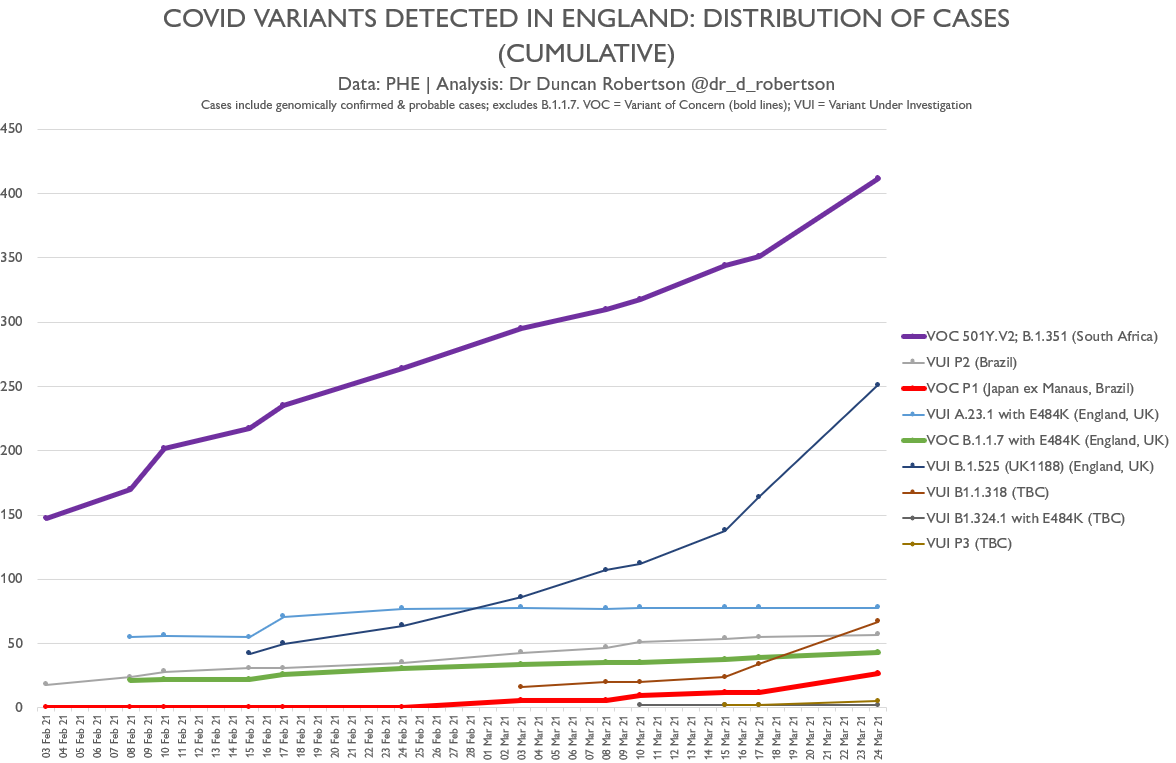
New Chart: Vaccine Variants
This is an issue for Test 4 of the unlocking Roadmap
Significant increase (from a relatively low level) for P1 (Manaus) variant (red); B1.351 (S Africa) (purple) increasing. Some cases detected by surge testing
This is 'data' in 'data not dates'
This is an issue for Test 4 of the unlocking Roadmap
Significant increase (from a relatively low level) for P1 (Manaus) variant (red); B1.351 (S Africa) (purple) increasing. Some cases detected by surge testing
This is 'data' in 'data not dates'

Here is my @skynews interview with @SkyNewsIsabel setting out the data that will inform further steps in the roadmap out of lockdown.
• • •
Missing some Tweet in this thread? You can try to
force a refresh


