The Government's roadmap for reopening has been published.
I will add commentary as I read through.
From first glance, there are no numbers for thresholds, which does in some way question the notion of 'data not dates'.
There are however a lot of dates in the document.
I will add commentary as I read through.
From first glance, there are no numbers for thresholds, which does in some way question the notion of 'data not dates'.
There are however a lot of dates in the document.

The roadmap itself is only 15 pages long.
It sets out 'principles'
- whole of England rather than regional response
- "led by data not dates" (see above)
- five weeks between steps - 'no earlier than'
- face-to-face education a priority
- whole of England rather than regional response
- "led by data not dates" (see above)
- five weeks between steps - 'no earlier than'
- face-to-face education a priority

Now we move on to 'the four tests'.
In order to make these rigourous, they would be accompanied by thresholds. Some vague words here. And they are 'currently being met' (see this thread
In order to make these rigourous, they would be accompanied by thresholds. Some vague words here. And they are 'currently being met' (see this thread
https://twitter.com/Dr_D_Robertson/status/1363782211930095617)

One page of the 15-pages of roadmap is taken up with repeating the four tests, except with pictures.

And... that's it for the tests. That's all we have - no numbers so the tests are vague and will or will not be met based on a political judgment.
So - no indication of how the data will determine whether the tests are *actually* met. It's very vague.
So - no indication of how the data will determine whether the tests are *actually* met. It's very vague.
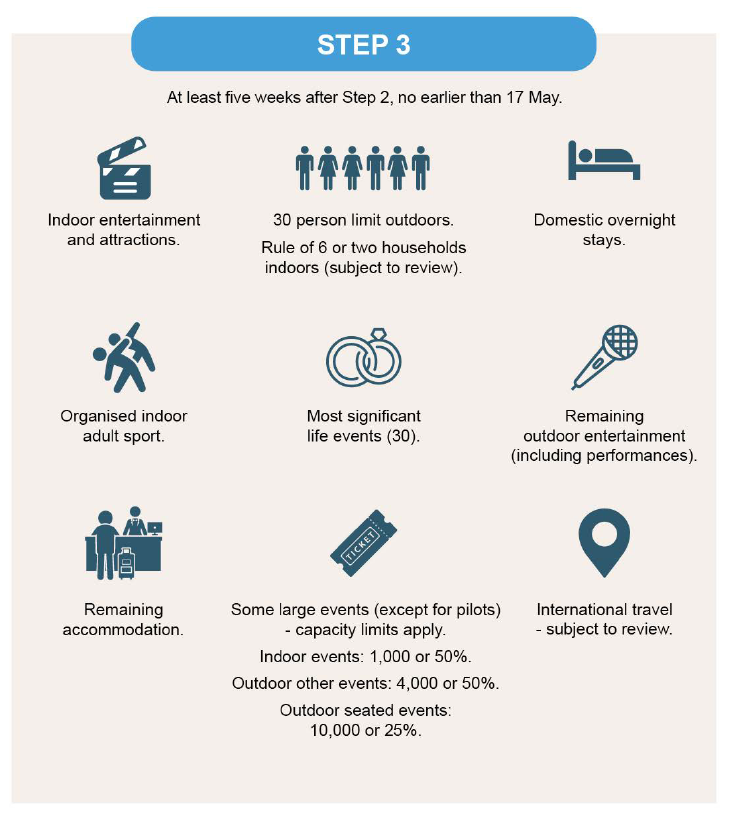
We move from the one paragraph and one picture setting out 'the tests' to 62 paragraphs setting out when relaxation will take place (with the caveat 'no earlier than')
Step 1 has two dates. What is interesting is that the decision to implement the rule of 6 or two households mixing *has been made now* and is not subject to revision. This is risky, as data from schools opening will be starting to be known and the 29 March changes are 'locked in'

The justification for this is that schools will close for Easter (so the risk from school transmission is replaced by the risk from outdoor mixing

Indoor transmission is emphasized (this is the justification for mixing *outdoors*).
This begs the question of what mitigation measures are being made in schools where mixing takes place indoors.
This begs the question of what mitigation measures are being made in schools where mixing takes place indoors.

Here are the pictures for Step 2 with the 'no earlier than' date

And Step 3
And Step 4

There is *no* mention in the roadmap of the Joint Biosecurity Centre (apart from future planning) - this was the organization that was tasked with analysis.
So - with this 'data driven' roadmap - who is deciding whether the four tests have been met? Is it entirely political?
So - with this 'data driven' roadmap - who is deciding whether the four tests have been met? Is it entirely political?

So - there are no thresholds set on whether the tests are met. There are a list of dates.
In summary, the roadmap can be considered "dates not data" with no objective measure of whether the four tests will be met.
The tests set out in the roadmap are subjective and political, not objective and scientific.
Here is the full document.
gov.uk/government/pub…
The tests set out in the roadmap are subjective and political, not objective and scientific.
Here is the full document.
gov.uk/government/pub…
Here is my @LBC interview this morning with @ianpaynesport discussing the Roadmap
- Dates not data
- Lack of role for Joint Biosecurity Centre
- SAGE show resurgence over summer increased hospitalizations & deaths
- Hospitalizations not case numbers or R
- Dates not data
- Lack of role for Joint Biosecurity Centre
- SAGE show resurgence over summer increased hospitalizations & deaths
- Hospitalizations not case numbers or R
• • •
Missing some Tweet in this thread? You can try to
force a refresh