My latest variants charts using data from @PHE_uk

*There is a new VUI B.1.617 (first detected in India) with 77 cases*

~ 8% increase in Kent (B.1.1.7)
~ 10% increase in B.1.351 (SA)
~ 11% in P.1 (Brazil)

Note *cumulative* charts, cases dependent on testing strategy

A thread
Here's the same data including B.1.1.7 and plotting on a log scale
77 appears to be a relatively high number of first detected cases for the B.1.617 Variant under Investigation first detected in India.

See this article for some commentary. I await PHE's expert analysis of the particular risks of B.1.617

forbes.com/sites/williamh…
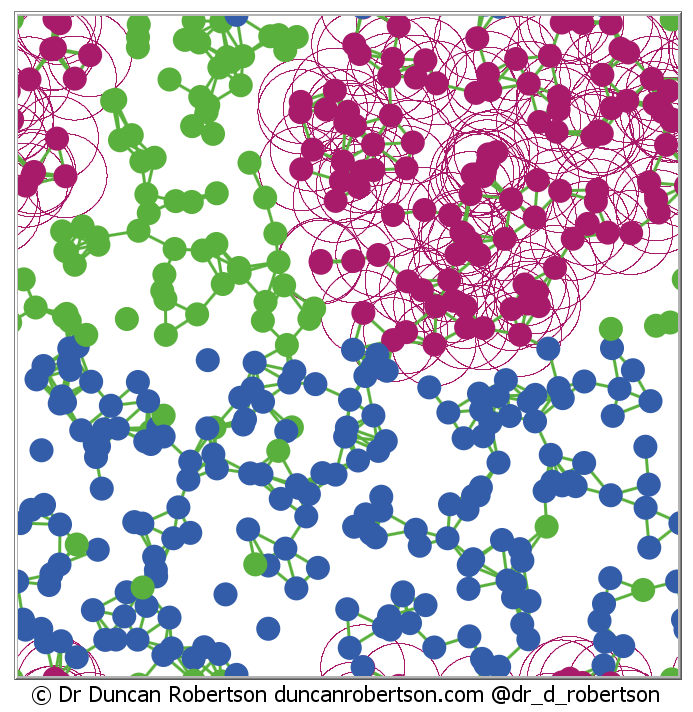
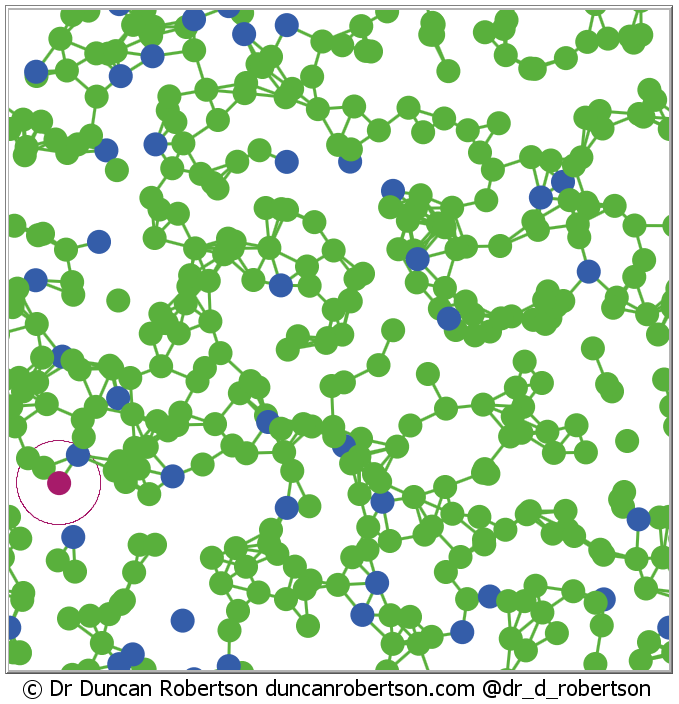
Here is my heatmap of Variants of Concern and Variants under Investigation detected in England (B.1.1.7 not highlighted). Note detection is dependent on testing.

Note the new VUI B.1.617 (first detected in India, bottom right) with the highest number of detected cases this week.
* detected cases reported this week. Some may have been detected previously and only reported this week due to B.1.617 being newly designated as a Variant under Investigation.
Here is a link to my updated charts which highlight B.1.617 more clearly

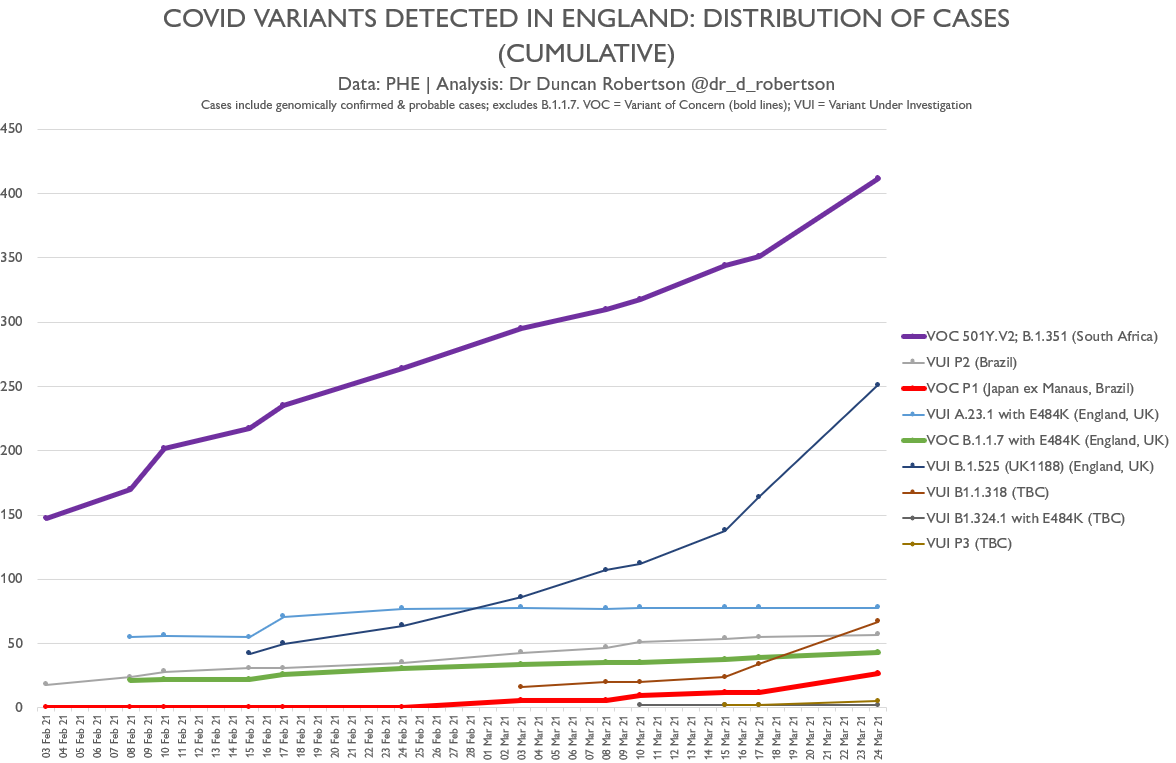
I have updated my charts for Variants of Concern and under Investigation.

The cases detected are for the United Kingdom not just England.

I have added the B.1.617 (first detected in India) variant in light blue so that it is highlighted.

Firstly, the *cumulative* chart
Secondly, the *cumulative* chart on a log scale. Some may find this more useful (note that we can't display 0 on a log chart, which is why the cases enter abruptly when they first appear).

But B.1.617 (first detected in India) is entering more abruptly than others.

• • •

Missing some Tweet in this thread? You can try to force a refresh
 

Keep Current with Dr Duncan Robertson

Dr Duncan Robertson Profile picture

Stay in touch and get notified when new unrolls are available from this author!

Read all threads

This Thread may be Removed Anytime!

PDF

Twitter may remove this content at anytime! Save it as PDF for later use!

Try unrolling a thread yourself!

how to unroll video
  1. Follow @ThreadReaderApp to mention us!

  2. From a Twitter thread mention us with a keyword "unroll"
@threadreaderapp unroll

Practice here first or read more on our help page!

More from @Dr_D_Robertson

15 Apr
Here are my updated charts which now highlight the B.1.617 Variant under Investigation (first detected in India) in blue

You can see the 77 cases reported this week as the light blue line

It is not clear from this 'initial report' whether all these cases were detected this week Image
Here's the same data on a logarithmic scale including B.1.1.7 (Kent)

It is clear that the number of B.1.617 (Variant under Investigation) first detected in India) is of significance.

Further work will be going on by experts at @PHE_uk to determine how significant. Image
The Roadmap fourth test that 'our assessment of the risks is not fundamentally changed by new Variants of Concern'.

It is worth remembering that even though the vaccination rollout is going extremely well, not everyone is vaccinated and vaccines are not 100% effective. Image
Read 4 tweets
14 Apr
The @ONS Infection Survey for antibody and vaccination data has been published here ons.gov.uk/peoplepopulati…

A thread. Image
"In England, ... 54.9% of the population (95% credible interval: 49.5% to 60.0%) would have tested positive for antibodies against the coronavirus (COVID-19)... on a blood test in the week ending 28 March 2021, suggesting they had the infection in the past or have been vaccinated
Imporant caveat:
"Across all four countries of the UK, there is a clear pattern between vaccination and testing positive for COVID-19 antibodies **but the detection of antibodies alone is not a precise measure of the immunity protection given by vaccination**.
Read 8 tweets
12 Apr
Herd Immunity.

I've built a model to show the concept of herd immunity.

It shows why we need to not leave hard-to-reach parts of the population unvaccinated.

A thread.
Herd immunity, also called population immunity, is the protection for the population that comes from when a proportion have been vaccinated.

With more vaccinations, we move towards this herd immunity threshold.

(We're not there yet, even though some say we are.)
Here's my model. Imagine a population in a country.

People are either susceptible (they may not be vaccinated or have had the virus). We colour these green.

People may have had the vaccine. These are blue.

And there's one (near the bottom left in purple) that is infectious
Read 14 tweets
10 Apr
SAGE 84 (25 March 2021)

"Prisons are highly prone to outbreaks of COVID-19 and consequent raised risks of hospitalisations and deaths (high confidence). Age-standardised mortality rates are significantly higher for prisoners than the general population. ...
" ... Incidence of disease, number and size of outbreaks, hospitalisation and mortality rates in prisons have increased markedly in wave 2 compared to wave 1 (high confidence). Prisons can act as amplifiers for community infection."
Read 4 tweets
1 Apr
A decision will shortly be made about whether we should move to Step 2 of the Roadmap for unlocking

The premise of moving to the next step is that it should be led by:
- data not dates; & be
- irreversible

A thread with my thoughts using the latest data.
The Roadmap tests are:

1. The vaccine deployment programme continues successfully
2. Evidence shows vaccines are sufficiently effective in reducing hospitalisations and deaths in those vaccinated
...
3. Infection rates do not risk a surge in hospitalisations which would put unsustainable pressure on the NHS
4. Our assessment of the risks is not fundamentally changed by new Variants of Concern
Read 13 tweets
26 Mar
Virus, vaccines, and variants. My heatmaps for cases, positivity, hospitalizations, ICU admissions in England.

New this week - charts for vaccine takeup and variants.

Vaccines - good; variants - concerning. We need to ensure that we use the data before unlocking further.
All charts this week start from the start of the vaccine rollout and show the (very severe) third wave.
Detected cases.

Increasing in 10-19 year olds (likely due to lateral flow testing in schools).

Increasing in 5-9 year olds. These are not routinely given lateral flow tests.

Other ages - rates decreasing.
Read 10 tweets

Did Thread Reader help you today?

Support us! We are indie developers!


This site is made by just two indie developers on a laptop doing marketing, support and development! Read more about the story.

Become a Premium Member ($3/month or $30/year) and get exclusive features!

Become Premium

Too expensive? Make a small donation by buying us coffee ($5) or help with server cost ($10)

Donate via Paypal Become our Patreon

Thank you for your support!

Follow Us on Twitter!