Today's Canadian vaccine update:

300!!

Big delivery day (over 12.6M doses now delivered)!!

Canada now has 22% of its population with one dose or more.
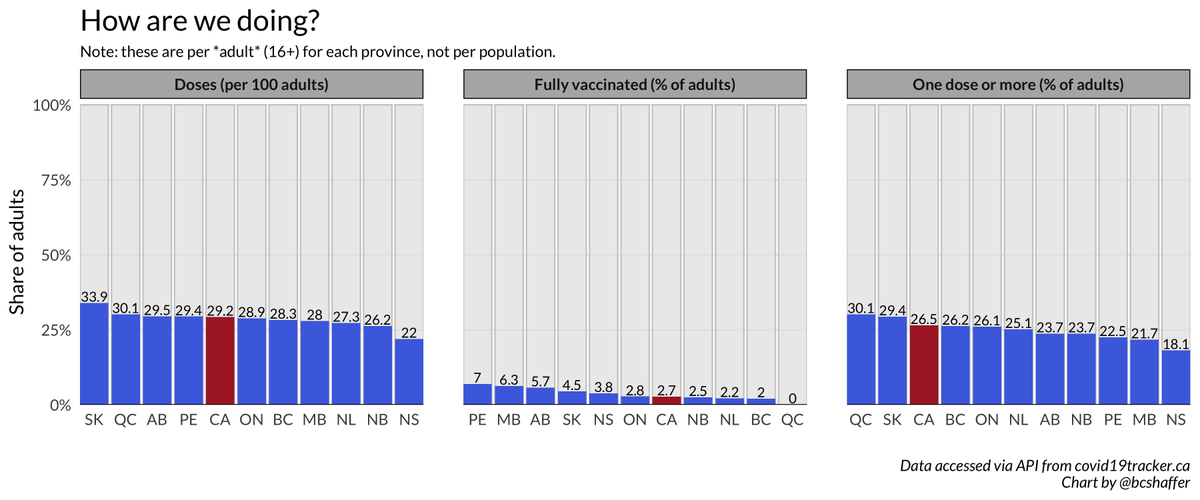
26.5% of Cdn adults now have one dose or more, 2.7% are fully vaccinated. QC leads the provinces in terms of one dose or more (30.1%), PE leads in terms of fully vaccinated (7.0%).
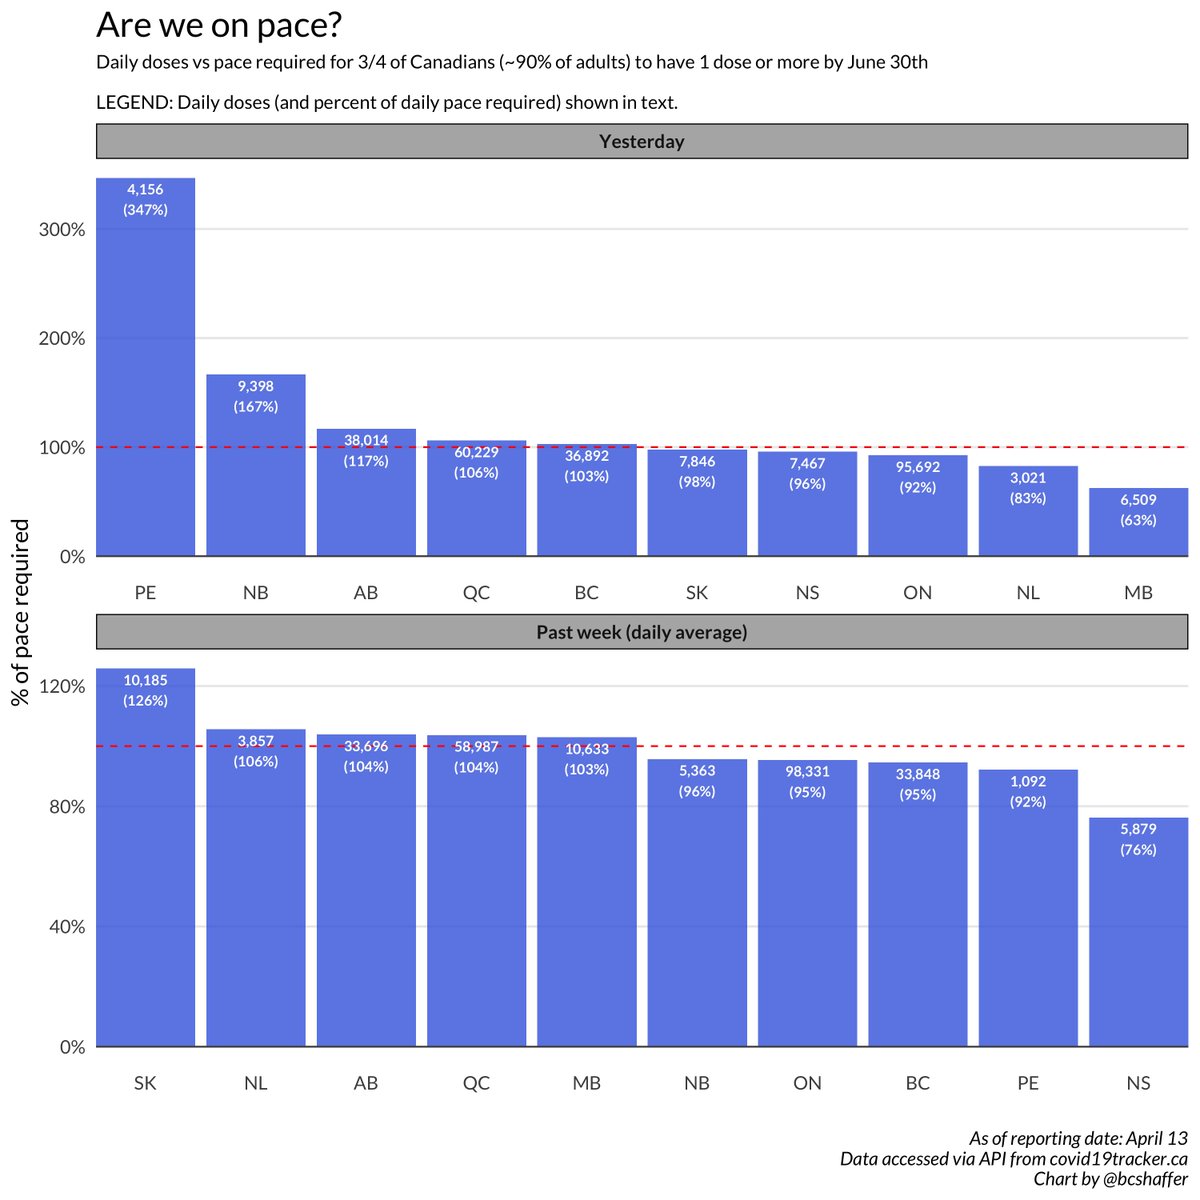
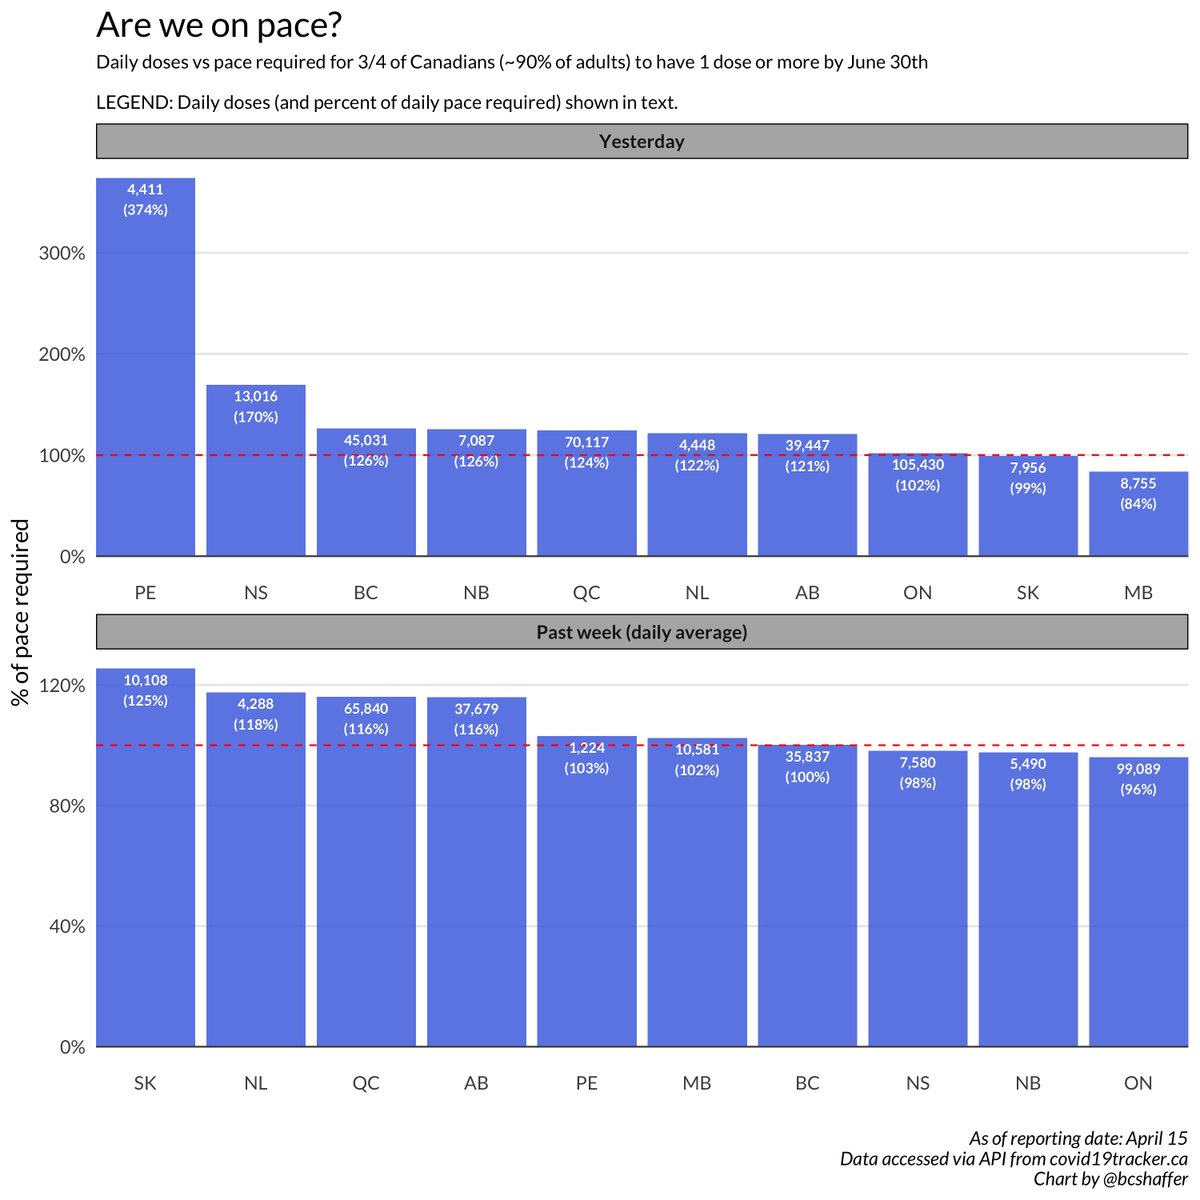
Yesterday 8 out of 10 provinces in Canada met the required pace to vaccinate 75% of population with one dose or more by June 30th.
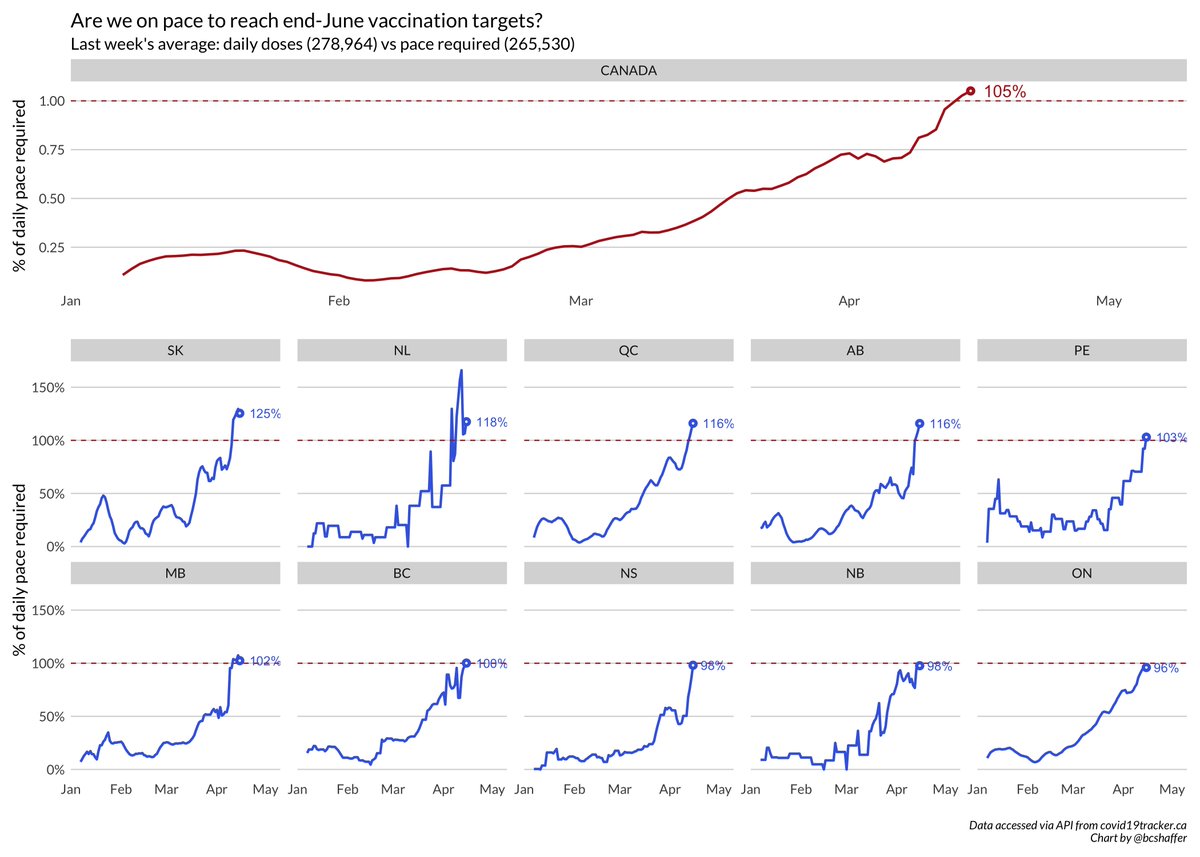
Are we on pace over time? Here is the 7 day moving average of the pace metric.

Canada is meeting the required pace!
The Scoreboard!

Among the provinces, SK leads in doses per 100 adults at 33.9%.
PE leads in share of fully vaccinated adults at 7.0%.
QC leads in share of adults with one dose or more at 30.1%
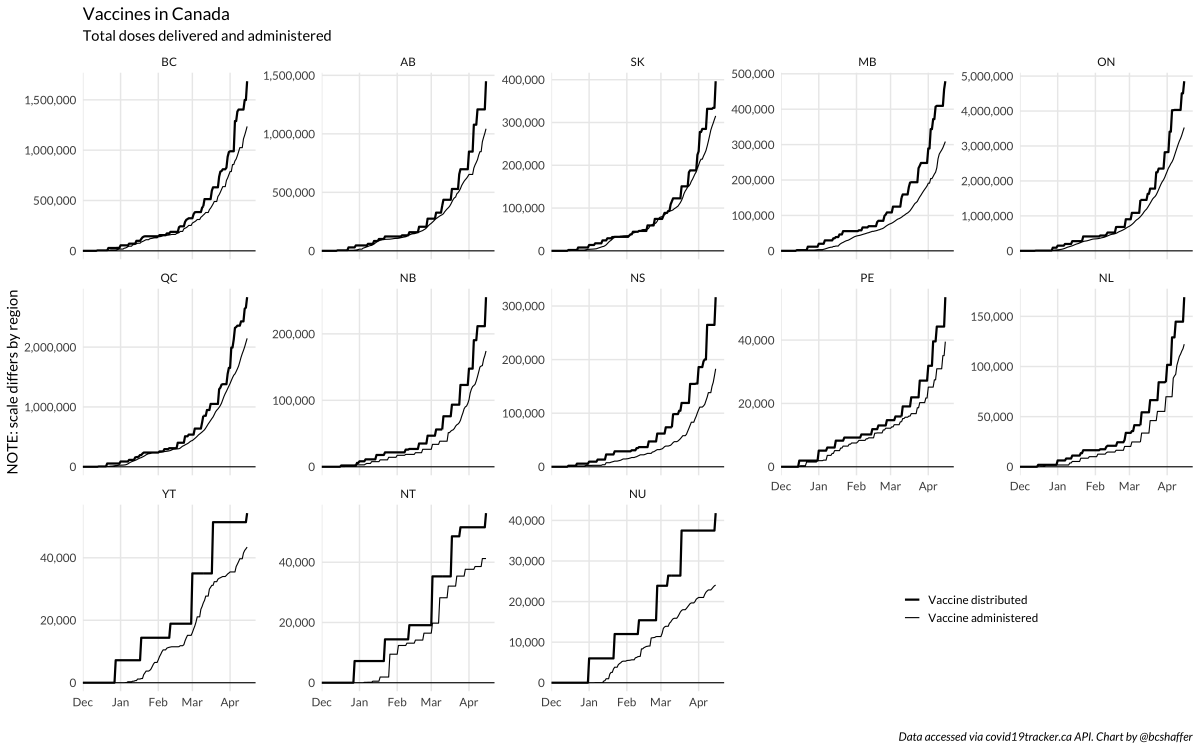
Deliveries vs Shots in Arms! Big delivery day today!
Last thing... How is Canada doing relative to the rest of the G20 for doses per 100.

Animated!
public.flourish.studio/visualisation/…

• • •

Missing some Tweet in this thread? You can try to force a refresh
 

Keep Current with Blake Shaffer 📊

Blake Shaffer 📊 Profile picture

Stay in touch and get notified when new unrolls are available from this author!

Read all threads

This Thread may be Removed Anytime!

PDF

Twitter may remove this content at anytime! Save it as PDF for later use!

Try unrolling a thread yourself!

how to unroll video
  1. Follow @ThreadReaderApp to mention us!

  2. From a Twitter thread mention us with a keyword "unroll"
@threadreaderapp unroll

Practice here first or read more on our help page!

More from @bcshaffer

15 Apr
So I've done a first read of the leaked CPC plan and have a few thoughts. #cdnecon #cdnpoli
1. Carbon pricing.

This will get all the attention today, and understandably given the CPC has made it their mantra to oppose carbon prices on households. So it's good they've relented, but the details matter here. And the details make this largely a gimmick...
Every $ spent will be returned to your personal account. Think of it like swiping a Carbon Miles™️ card at the pump. So all those critiques of the Lib rebates ("why have a tax if you just get your money back") are actually valid here! The catch is your spending is restricted...
Read 11 tweets
14 Apr
Today's Canadian vaccine update:

Nearly 300k doses today! Canada now has over 21% of its population with one dose or more, over 25% of adults.
25.6% of Cdn adults now have one dose or more, 2.7% are fully vaccinated. QC leads the provinces in terms of one dose or more (29.2%), PE leads in terms of fully vaccinated (6.5%).
Yesterday 6 out of 10 provinces in Canada met the required pace to vaccinate 75% of population with one dose or more by June 30th.
Read 6 tweets
13 Apr
Today's Canadian vaccine update:

Canada now has over 20% of its population with one dose or more, nearly 25% of adults. Image
24.7% of Cdn adults now have one dose or more, 2.6% are fully vaccinated. QC leads the provinces in terms of one dose or more (28.2%), PE leads in terms of fully vaccinated (6.5%). Image
Yesterday 5 out of 10 provinces in Canada met the required pace to vaccinate 75% of population with one dose or more by June 30th. Note: PEI dumped several days of data today. Image
Read 9 tweets
4 Mar
*refresh*
*refresh*
*refresh*
Did AHS write the code the AB Parks too?
Read 5 tweets
3 Mar
A quick thread on the interconnectedness of power and NG markets. Others have discussed the interdependence and asymmetries of these two energy markets (e.g. @CostaSamaras & @MichaelEWebber).

I want to talk about how the Texas cold snap propagated through power & gas markets.
Let's start with Texas itself. Here's North Hub day-ahead market prices for power during the event. Pinned at $8000-9000/MWh through the event. Now back to a more typical $20. Image
And here's gas in Texas, namely the Waha hub in West Texas. Reaching $200/MMbtu, from a more typical $2-3. Other points reached even higher prices.

The demand for gas for both direct heat and power gen clearly links these two commodities within Texas. Image
Read 9 tweets
24 Feb
Quick (chart) thread on Ercot generation during the power outages.

Can't recall who made this plot, but it's excellent (albeit without y-axes!!).

Changes over time are informative, but not the whole story. Image
In terms of how each fuel type performed, we not only want to judge its absolute production, but also relative to what was expected of it.

Ercot did a Winter 2020/21 resource adequacy assessment in November and came up with the following:
67GW thermal+hydro
7GW wind
0.3GW solar Image
They also ran "risk scenarios", essentially more thermal outages or less wind. Interestingly they didn't run the extreme forced thermal outage *AND* the extreme low wind scenario together! Image
Read 10 tweets

Did Thread Reader help you today?

Support us! We are indie developers!


This site is made by just two indie developers on a laptop doing marketing, support and development! Read more about the story.

Become a Premium Member ($3/month or $30/year) and get exclusive features!

Become Premium

Too expensive? Make a small donation by buying us coffee ($5) or help with server cost ($10)

Donate via Paypal Become our Patreon

Thank you for your support!

Follow Us on Twitter!