#Bitcoin update - this one is important
1/n
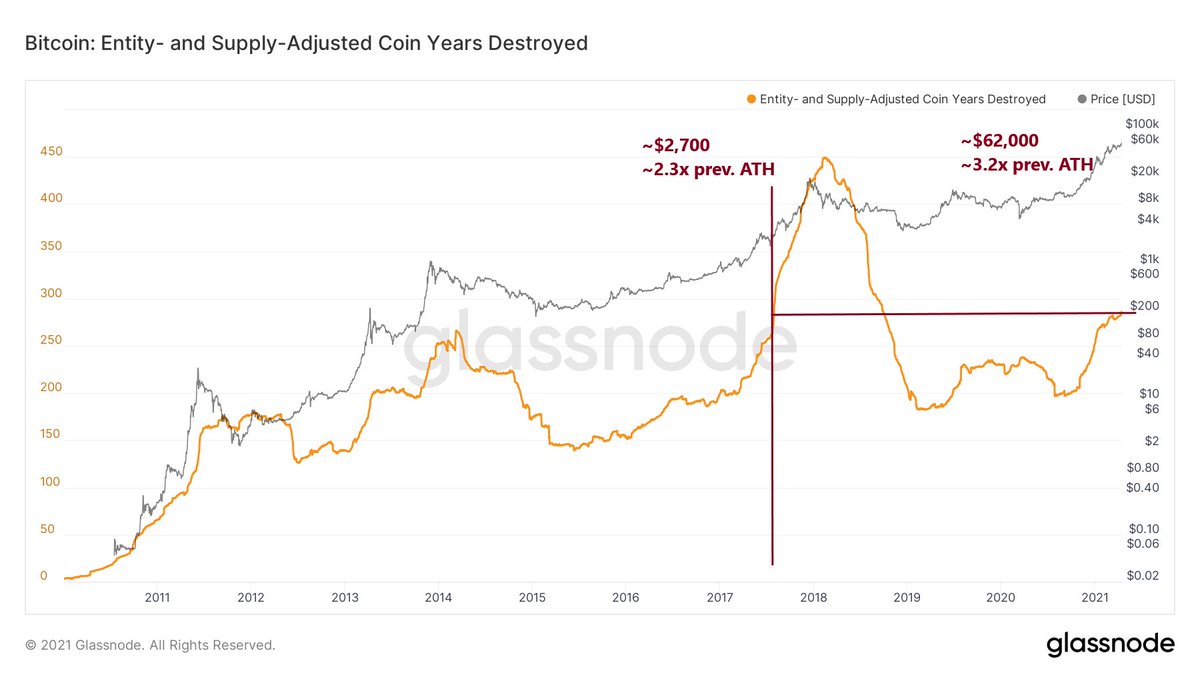
This chart shows the entity and supply adjusted coin years destroyed and I think it is bullish as hell and shows how this cycle is different and why we see certain trends such as declining exchange balances.
Thread 👇
1/n
This chart shows the entity and supply adjusted coin years destroyed and I think it is bullish as hell and shows how this cycle is different and why we see certain trends such as declining exchange balances.
Thread 👇
2/n
The metric shows the rolling sum over 1 year of coin days destroyed. When it rises, more older coins got sold and this signals that longer-term holders are less confident in further upside and/or realize profits.
The metric shows the rolling sum over 1 year of coin days destroyed. When it rises, more older coins got sold and this signals that longer-term holders are less confident in further upside and/or realize profits.
3/n
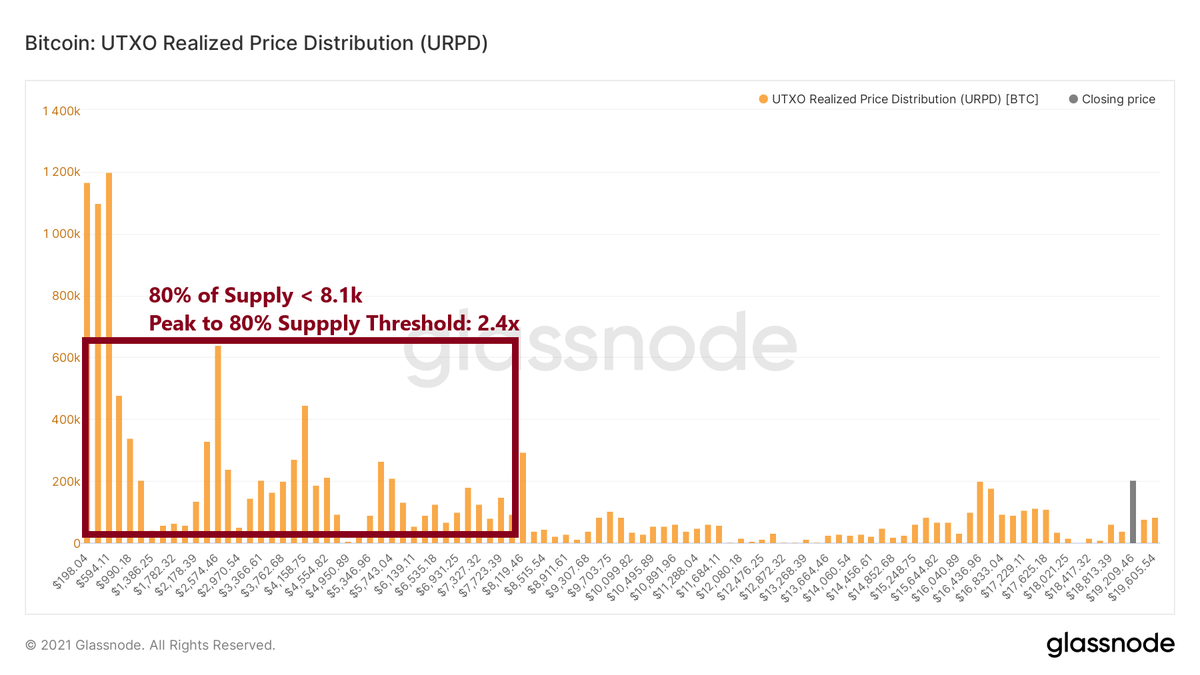
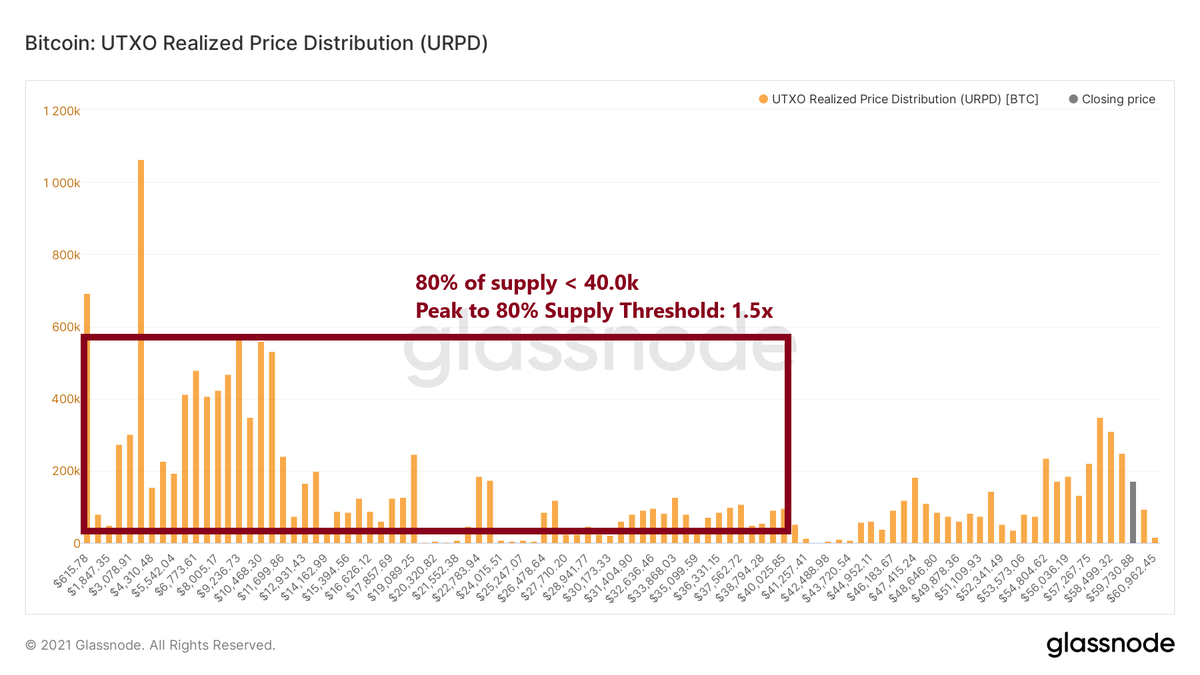
If we compare the current level to 2017, we were only at price of $2,700, which was 2.3 times higher than the previous cycle peak, whereas today we are already at 3.2x the previous cycle peak. The incentive to sell comparing the stages in the cycles would be higher today!
If we compare the current level to 2017, we were only at price of $2,700, which was 2.3 times higher than the previous cycle peak, whereas today we are already at 3.2x the previous cycle peak. The incentive to sell comparing the stages in the cycles would be higher today!
4/n
However, the overall trend of this metric is rising, which is not surprising as the market gets older on average. This is very important as it puts the current situation in a different spotlight and makes it even more bullish, when we just compare it 1:1 to 2017.
However, the overall trend of this metric is rising, which is not surprising as the market gets older on average. This is very important as it puts the current situation in a different spotlight and makes it even more bullish, when we just compare it 1:1 to 2017.
5/n
This means that in this cycle there seems to be less selling of older coins. I interpret this with a higher confidence from LT holders, which might come from different reasons, but in 2017 I believe the long term future of #bitcoin was simply less certain than today.
This means that in this cycle there seems to be less selling of older coins. I interpret this with a higher confidence from LT holders, which might come from different reasons, but in 2017 I believe the long term future of #bitcoin was simply less certain than today.
6/n
I'm not claiming there are no risks anymore, but I believe with broad institutional adoption and #Bitcoin now sitting on balance sheets etc. provides more confidence than even if another heavy bear market comes, #Bitcoin is here to stay and will go higher ultimately.
I'm not claiming there are no risks anymore, but I believe with broad institutional adoption and #Bitcoin now sitting on balance sheets etc. provides more confidence than even if another heavy bear market comes, #Bitcoin is here to stay and will go higher ultimately.
7/n
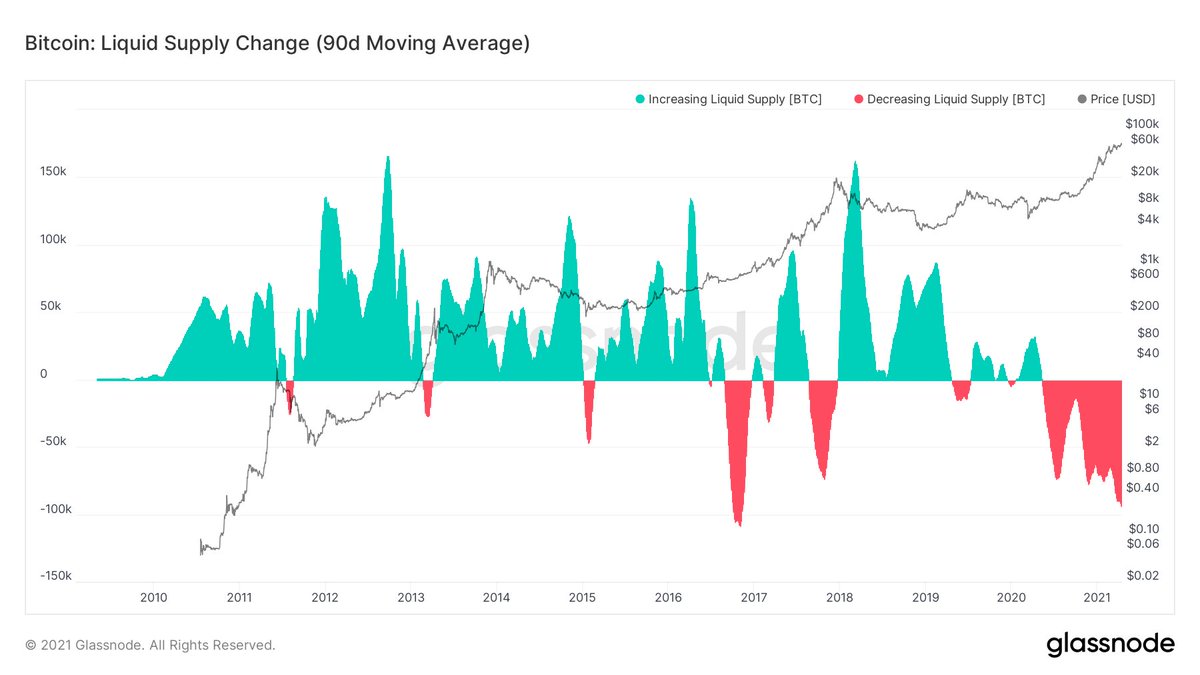
This confidence leads to less willingness of longer-term investors to sell coins to new investors lining up and waiting to get in. I believe this is exactly what we are seeing in metrics such as liquid supply or exchange balances.
This confidence leads to less willingness of longer-term investors to sell coins to new investors lining up and waiting to get in. I believe this is exactly what we are seeing in metrics such as liquid supply or exchange balances.
8/n
New investors come in and many of them are themselves in for the longer-term and they get the liquidity rather from shorter-term focus investors with higher turnover than from longer-term investors that are less and less willing to sell.
New investors come in and many of them are themselves in for the longer-term and they get the liquidity rather from shorter-term focus investors with higher turnover than from longer-term investors that are less and less willing to sell.
9/n
This should create an interesting supply/demand tension and therefore I think this cycle will lead us way higher. from here.
This should create an interesting supply/demand tension and therefore I think this cycle will lead us way higher. from here.
• • •
Missing some Tweet in this thread? You can try to
force a refresh