PHE's surveillance report for 12th to 18th April now out. 🧵
Second week of school holidays for most, but some schools will have gone back.
Tl,dr:
- case numbers down & vaccination up
- persistent inequalities by geography, ethnicity, & deprivation
gov.uk/government/sta…
Second week of school holidays for most, but some schools will have gone back.
Tl,dr:
- case numbers down & vaccination up
- persistent inequalities by geography, ethnicity, & deprivation
gov.uk/government/sta…
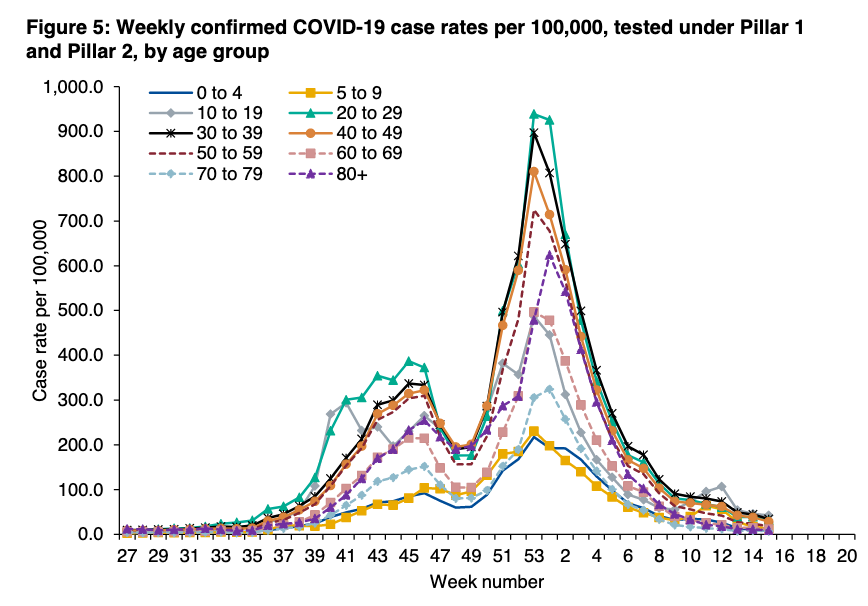
Case rates & positivity continue to fall across the age groups with no clear sign of pre-Easter rise in school-age cases leading to more infection in older ages.
Highest in 10-19y/o (42 per 100,000) and lowest among 70-79y/o at just 7.2/100,000.
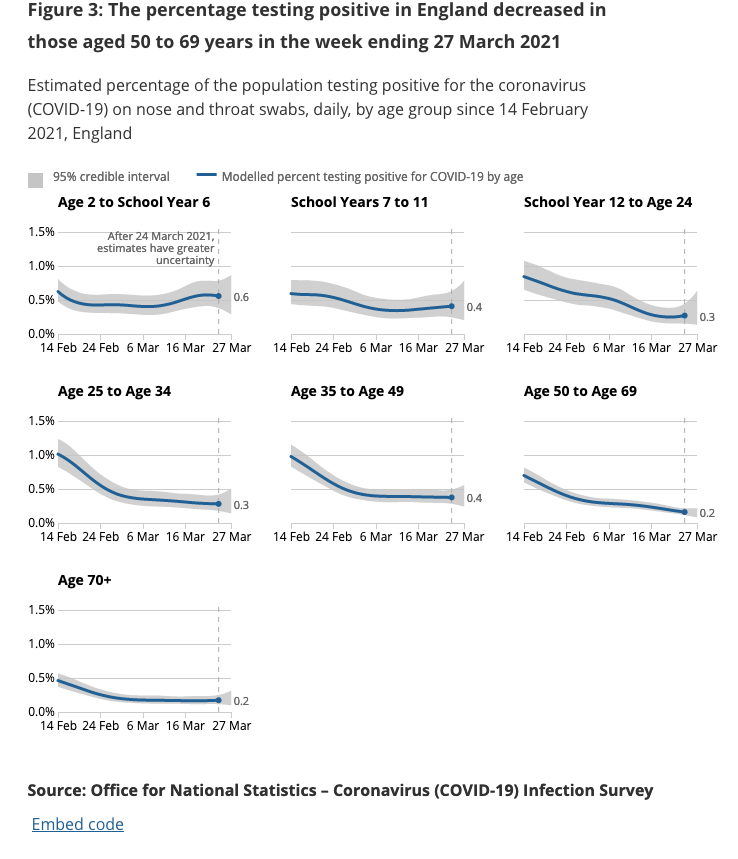
A pattern matched by ONS survey
Highest in 10-19y/o (42 per 100,000) and lowest among 70-79y/o at just 7.2/100,000.
A pattern matched by ONS survey


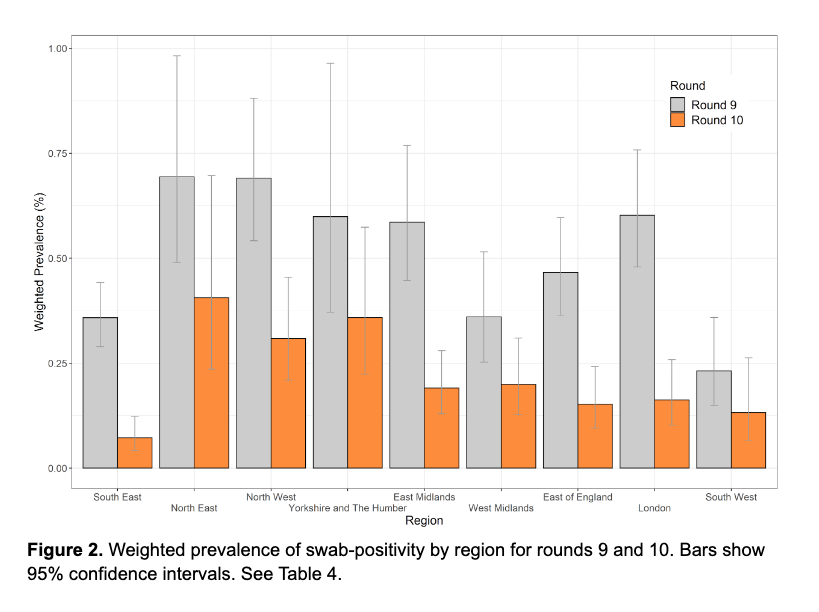
Case rates also falling across all the regions, with slightly higher rates in Yorkshire and Humber (45 cases per 100,000 compared with just 14/100,000 in the SW).
Again not dissimilar to ONS and good to see case rates come down (next ONS update due tomorrow)
Again not dissimilar to ONS and good to see case rates come down (next ONS update due tomorrow)
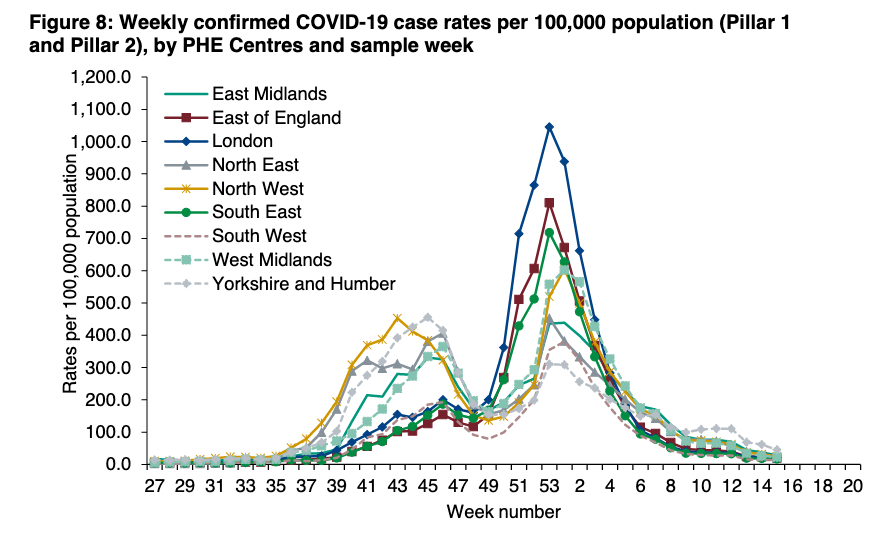

This does mask some differences by age - particularly look at Y&H, as well as 10-19y/o in EofE, London, and SE.
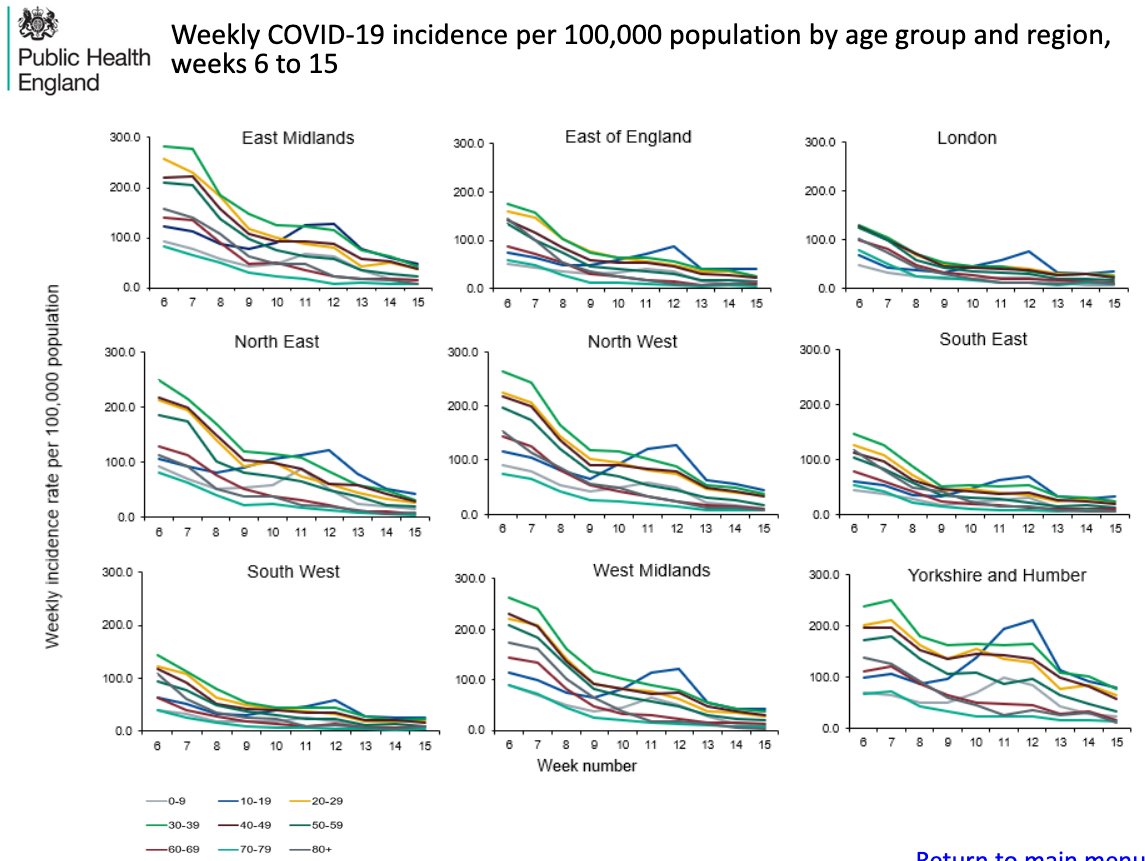
The upper tier local authority data show this even more starkly.
Whilst case rates are generally falling everywhere, the same places still have the highest rates.
They range from 74 cases per 100,000 in Doncaster to just 7/100,000 in Torbay.
A factor of 10.
Whilst case rates are generally falling everywhere, the same places still have the highest rates.
They range from 74 cases per 100,000 in Doncaster to just 7/100,000 in Torbay.
A factor of 10.

And just to emphasise this point, the places with high case rates in the most recent week generally overlap with the cumulative highest case rates, and highest death rates.


As have said multiple times, this is largely driven by structural inequalities - job security, housing - @louisemarsha11 and I wrote about this again just this week.
https://twitter.com/ADMBriggs/status/1384254281809760267?s=20
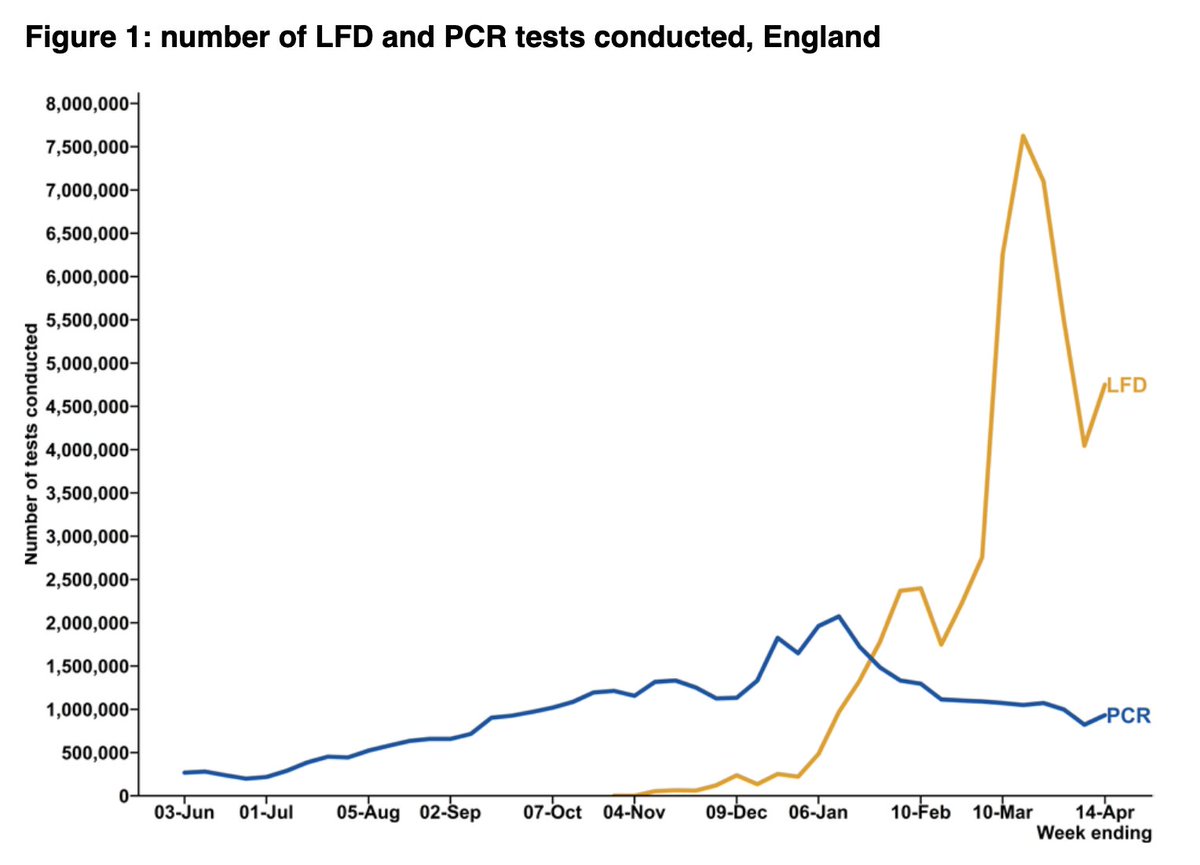
Percentage of tests that are positive for PCR now just 0.89% (PCR uptake relatively static)
and for LFDs it's 0.15%, falling as LFD use increases (LFDs were available to everyone from 9th April).
and for LFDs it's 0.15%, falling as LFD use increases (LFDs were available to everyone from 9th April).

Differences by ethnicity may not be particularly obvious overall, but they are still apparent when looking at the regional data.


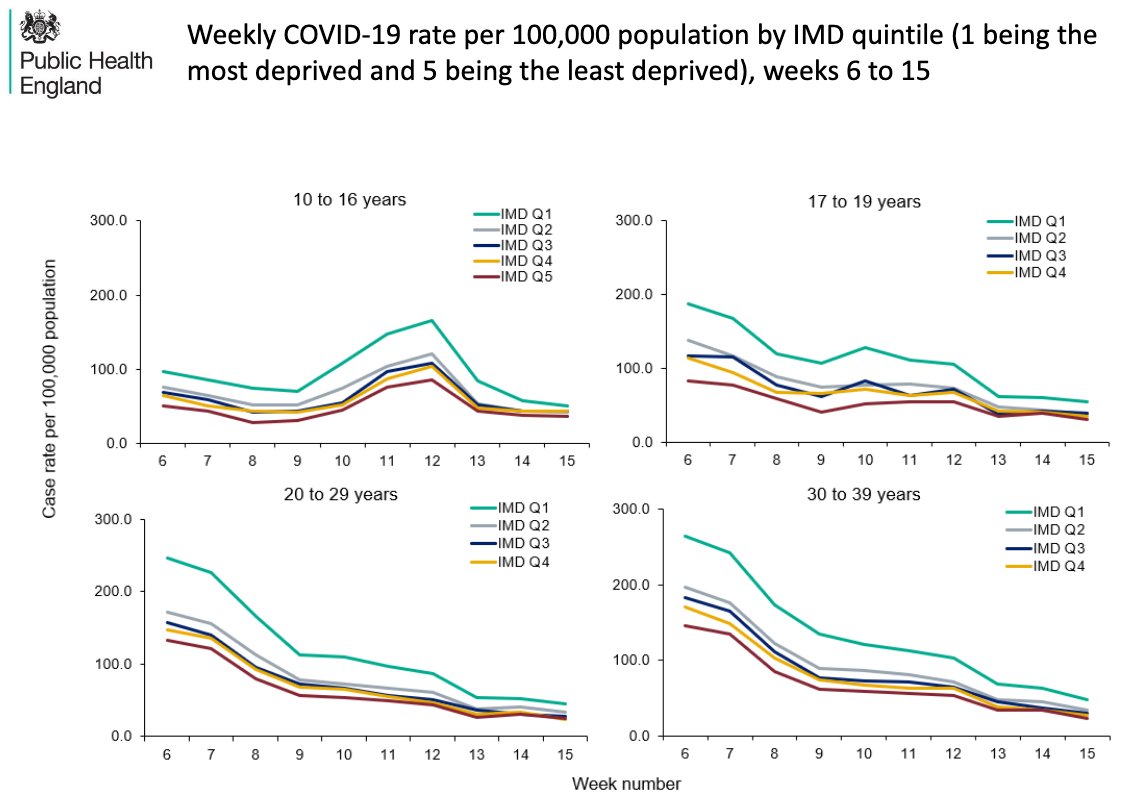
And for deprivation it's easier to see.
Both the inequalities in case rates by deprivation and ethnicity will underlying much of the difference in case rates seen at local authority level.
Both the inequalities in case rates by deprivation and ethnicity will underlying much of the difference in case rates seen at local authority level.
When it comes to outbreaks, care home and hospital outbreaks remain as low as they've ever been.

As do schools given the Easter hols.

Perhaps still a little early but a good sign to see no signal (yet) for outbreaks/incidents in workplaces notified to PHE either.

As has been widely reported, hospital admissions continue to fall across the country.


And as community infection rates fall and younger people start getting their first jab, ICU admissions are also still falling.


It's important to remember that people are still dying from COVID-19, but the numbers are orders of magnitude better than they have been.


And finally, first dose vaccine uptake is now over 90% for *ALL* age groups >65yrs.
This is pretty incredible and a huge achievement for everyone involved. Bear in mind that most years flu vaccination uptake for over 65y/os peaks at around 70%. /end
This is pretty incredible and a huge achievement for everyone involved. Bear in mind that most years flu vaccination uptake for over 65y/os peaks at around 70%. /end
https://twitter.com/PHE_uk/status/1385221499490025477?s=20
PHE surveil rpt☝️ @felly500 @deb_cohen @martinmckee @carolecadwalla @mgtmccartney @ADPHUK @Jeanelleuk @fascinatorfun @profchrisham @petermbenglish @HPIAndyCowper
@Davewwest @HSJEditor @KateAlvanley @IndependentSage @nedwards_1 @SamanthaJonesUK @ewanbirney @FurberA @Dr_D_Robertson
@Davewwest @HSJEditor @KateAlvanley @IndependentSage @nedwards_1 @SamanthaJonesUK @ewanbirney @FurberA @Dr_D_Robertson
• • •
Missing some Tweet in this thread? You can try to
force a refresh