How big are the new climate pledges from the US, UK, EU, Canada & Japan?

I reckon they could cut emissions in 2030 by roughly an extra 2bn tonnes of CO2e

That's quite a lot…

…but still tiny compared with the 12-32GtCO2e "emissions gap" to 1.5 or 2C

carbonbrief.org/unep-net-zero-…
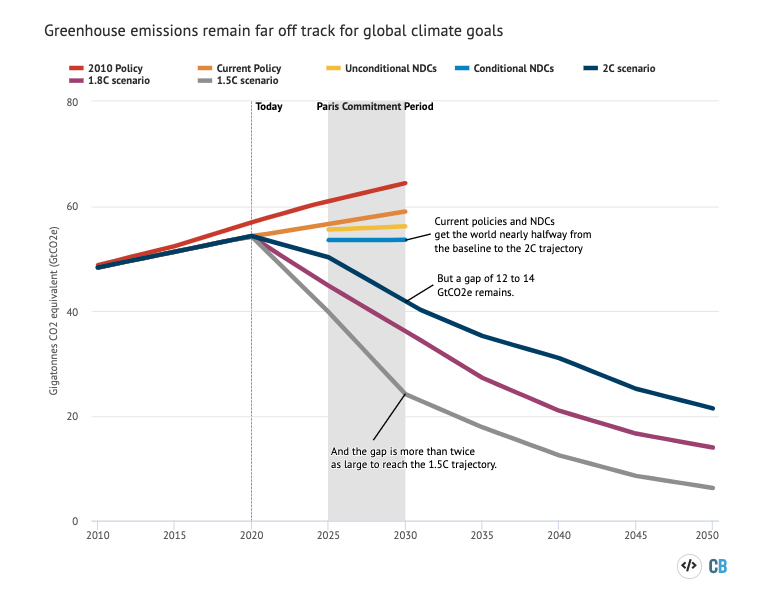
This is very much a back-of-the-envelope number and depends what you assume would have happened, before the new pledges.

We can expect to see more sophisticated estimates from @climateactiontr & @UNEP
@climateactiontr @UNEP Also – this assumes the new ambitions are turned into reality

That's very much a big "if"

• • •

Missing some Tweet in this thread? You can try to force a refresh
 

Keep Current with Simon Evans

Simon Evans Profile picture

Stay in touch and get notified when new unrolls are available from this author!

Read all threads

This Thread may be Removed Anytime!

PDF

Twitter may remove this content at anytime! Save it as PDF for later use!

Try unrolling a thread yourself!

how to unroll video
  1. Follow @ThreadReaderApp to mention us!

  2. From a Twitter thread mention us with a keyword "unroll"
@threadreaderapp unroll

Practice here first or read more on our help page!

More from @DrSimEvans

23 Apr
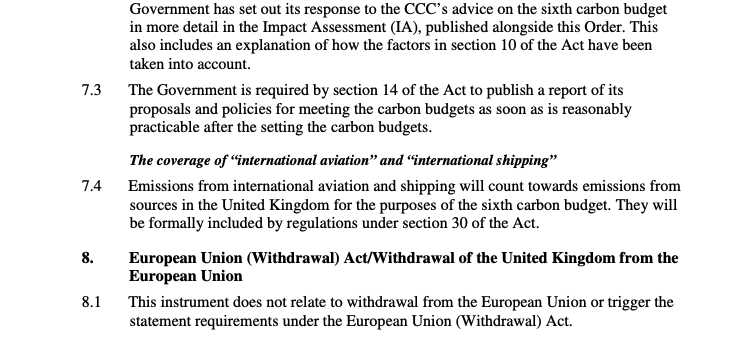
The UK govt has formally issued draft legislation, making its 78% by 2035 climate goal into law

legislation.gov.uk/ukdsi/2021/978…
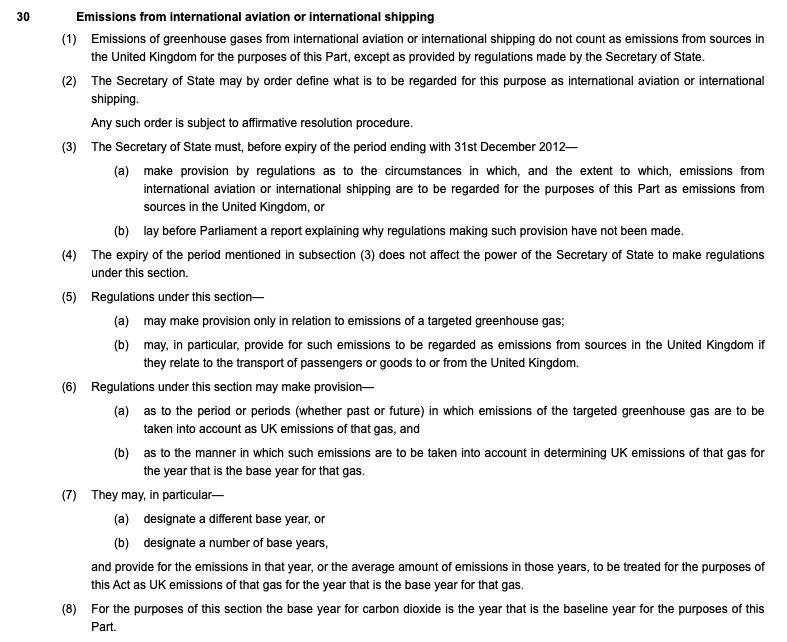
It does not (yet) legislate to include international aviation and shipping in the budget, but additional regulations on that will follow

legislation.gov.uk/ukdsi/2021/978…
for reference, here's Article 30 of the Climate Change Act under which international aviation and shipping will be included

legislation.gov.uk/ukpga/2008/27/…
Read 9 tweets
22 Apr
We've now had four big new climate goals announced

UK -68% below 1990
EU -55% below 1990
US -52% below 2005
JP -46% below 2013

Who is most ambitious?

Depends on the baseline…

1990 UK>EU>US>JP
2005 UK>US>EU>JP
2013 UK>US>EU>JP
2018 US>UK>EU>JP
For those that prefer ugly spreadsheet tables…
Read 4 tweets
29 Mar
The world's electricity over the past 30yrs:

1990 🏭🏭🏭🏭🏭🏭💦💦☢️☢️ (64% fossil)
2000 🏭🏭🏭🏭🏭🏭💦💦☢️☢️
2010 🏭🏭🏭🏭🏭🏭🏭💦💦☢️
2020 🏭🏭🏭🏭🏭🏭💦💦☢️🌄 (61%)

😭😭😭

Plus ça change? 🧵

(Data: BP / @EmberClimate)
Here's the same data in chart form…

Fossil fuels supplied 64% of the world's electricity in 1990 and that fell by just 3 percentage points over the following three decades to 2020 (61%)
But let's take a peak underneath the bonnet…

To begin, let's make this *even more depressing* by looking at amounts as well as percentages

Because fossil electricity supplies have *more than doubled* since 1990 – and that what matters for CO2

(even tho gas better than coal)
Read 9 tweets
26 Mar
Wow OK, so the UK's land sector is now a source, not a sink of greenhouse gas emissions

Needs to be a sink if UK is going to reach net-zero…

What happened? 🧵
I noticed the switch because it helped make my annual estimate of UK emissions less accurate than usual

But I wasn't sure what was going on until now (and I suspect this still isn't the whole story)

Thanks to @mattadamw @stv_smth @david_joffe for pointers!
Read 15 tweets
25 Mar
Last week for @CarbonBrief I estimated UK emissions fell 10.7% last yr, taking them to 51% below 1990 levels

Today, BEIS says it was an 8.9% drop in 2020, bringing us to 49% below 1990 levels

Why are these numbers (slightly) different?

THREAD 🧵

carbonbrief.org/analysis-uk-is… Image
TL;DR most of the difference between my estimate of UK emissions in 2020 & the official BEIS figure is due to revisions in the underlying energy & emissions data

For more detail, read on…

carbonbrief.org/analysis-uk-is… Image
Overall, our estimates are similar. We both said the drop last year was the fastest in at least 30yrs, due to Covid

And I'd say 49% still counts as "halfway" (per our headline last week) – splitting hairs to say otherwise

carbonbrief.org/analysis-uk-is…
Read 12 tweets
18 Mar
My new analysis shows UK greenhouse gas emissions are now halfway to net-zero, down 51% on 1990 levels

Yet there's likely to be a rebound after Covid, showing the challenge of eliminating our remaining emissions

THREAD w all the details + caveats

1/n

carbonbrief.org/analysis-uk-is…
Before I do the details…

Caveat A)

Numbers exclude intl aviation and shipping. Last yr saw 60% drop in intl aviation emissions (!) but sector is up since 1990. CCC says shd inc in net-zero goal

2/

carbonbrief.org/analysis-uk-is…
Caveat B)

Numbers excl emissions due to imported goods and services

I don't have data to look at this – figures are uncertain + usually come out several years in arrears

Latest shows consumption emissions falling since 2007 + now lowest in 20yrs

3/

carbonbrief.org/guest-post-the…
Read 17 tweets

Did Thread Reader help you today?

Support us! We are indie developers!


This site is made by just two indie developers on a laptop doing marketing, support and development! Read more about the story.

Become a Premium Member ($3/month or $30/year) and get exclusive features!

Become Premium

Too expensive? Make a small donation by buying us coffee ($5) or help with server cost ($10)

Donate via Paypal Become our Patreon

Thank you for your support!

Follow Us on Twitter!