The world's electricity over the past 30yrs:
1990 🏭🏭🏭🏭🏭🏭💦💦☢️☢️ (64% fossil)
2000 🏭🏭🏭🏭🏭🏭💦💦☢️☢️
2010 🏭🏭🏭🏭🏭🏭🏭💦💦☢️
2020 🏭🏭🏭🏭🏭🏭💦💦☢️🌄 (61%)
😭😭😭
Plus ça change? 🧵
(Data: BP / @EmberClimate)
1990 🏭🏭🏭🏭🏭🏭💦💦☢️☢️ (64% fossil)
2000 🏭🏭🏭🏭🏭🏭💦💦☢️☢️
2010 🏭🏭🏭🏭🏭🏭🏭💦💦☢️
2020 🏭🏭🏭🏭🏭🏭💦💦☢️🌄 (61%)
😭😭😭
Plus ça change? 🧵
(Data: BP / @EmberClimate)
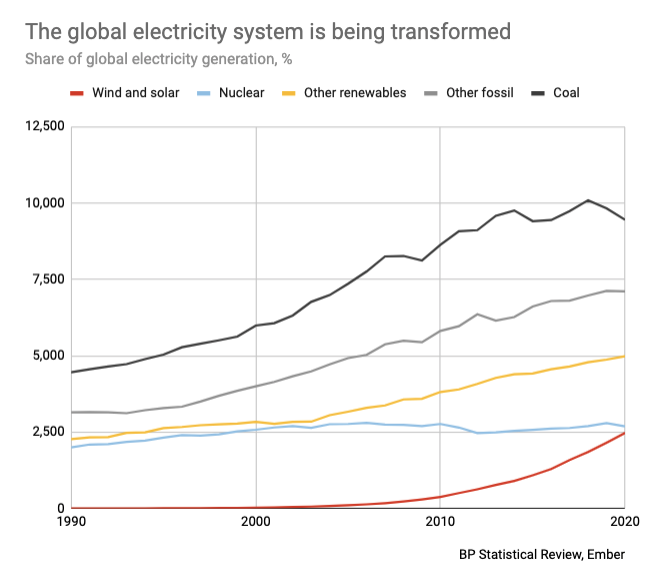
Here's the same data in chart form…
Fossil fuels supplied 64% of the world's electricity in 1990 and that fell by just 3 percentage points over the following three decades to 2020 (61%)
Fossil fuels supplied 64% of the world's electricity in 1990 and that fell by just 3 percentage points over the following three decades to 2020 (61%)

But let's take a peak underneath the bonnet…
To begin, let's make this *even more depressing* by looking at amounts as well as percentages
Because fossil electricity supplies have *more than doubled* since 1990 – and that what matters for CO2
(even tho gas better than coal)
To begin, let's make this *even more depressing* by looking at amounts as well as percentages
Because fossil electricity supplies have *more than doubled* since 1990 – and that what matters for CO2
(even tho gas better than coal)

Now…did you see the dip in the last chart?
That's where things start to get interesting
Because last year, coal generation fell by the largest amount on record (-350TWh, UK's annual demand)
And that broke a record decline set just a year earlier
That's where things start to get interesting
Because last year, coal generation fell by the largest amount on record (-350TWh, UK's annual demand)
And that broke a record decline set just a year earlier

Some of the 2020 picture is down to Covid – but that obviously doesn't explain 2019
So – there's a structural shift going on too
Can you see what it is?
So – there's a structural shift going on too
Can you see what it is?
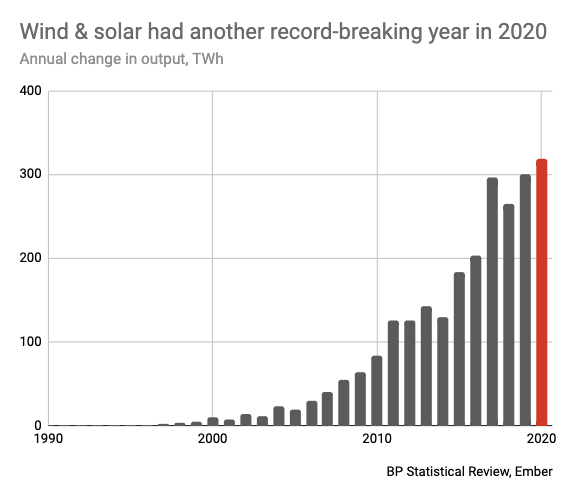
Wind and solar started off small
But in 2020 they grew faster than ever before, adding a nearly UK-sized chunk of clean electricity (315TWh)
And they've seen record-breaking growth in almost every year since 2000
But in 2020 they grew faster than ever before, adding a nearly UK-sized chunk of clean electricity (315TWh)
And they've seen record-breaking growth in almost every year since 2000
Put it all together and we see a different picture
The world's electricity system is being transformed at an accelerating pace
In a single decade, wind & solar have gained 8 percentage points of the global mix, up from 1.8 to 9.4%
And coal is down 6 points, from 40 to 34%
The world's electricity system is being transformed at an accelerating pace
In a single decade, wind & solar have gained 8 percentage points of the global mix, up from 1.8 to 9.4%
And coal is down 6 points, from 40 to 34%

Where next?
The IEA says solar is *already* the "cheapest electricity in history"
It says renewables will meet 80% of the increase in demand over the decade ahead
And they will overtake coal as the world's top electricity source within 5yrs
The IEA says solar is *already* the "cheapest electricity in history"
It says renewables will meet 80% of the increase in demand over the decade ahead
And they will overtake coal as the world's top electricity source within 5yrs

<was delayed by 🥮>
Final thought – as ever, the world remains a very long way from the path towards 1.5 or 2C
That's true in the electricity sector, where progress is accelerating
And even more so for transport, industry, buildings etc
carbonbrief.org/unep-net-zero-…
Final thought – as ever, the world remains a very long way from the path towards 1.5 or 2C
That's true in the electricity sector, where progress is accelerating
And even more so for transport, industry, buildings etc
carbonbrief.org/unep-net-zero-…

• • •
Missing some Tweet in this thread? You can try to
force a refresh