Wow OK, so the UK's land sector is now a source, not a sink of greenhouse gas emissions
Needs to be a sink if UK is going to reach net-zero…
What happened? 🧵
Needs to be a sink if UK is going to reach net-zero…
What happened? 🧵

I noticed the switch because it helped make my annual estimate of UK emissions less accurate than usual
https://twitter.com/DrSimEvans/status/1375093206061301767
But I wasn't sure what was going on until now (and I suspect this still isn't the whole story)
Thanks to @mattadamw @stv_smth @david_joffe for pointers!
Thanks to @mattadamw @stv_smth @david_joffe for pointers!
The switch is due to improved estimates of emissions from peatland, adding 15-20MtCO2e to the UK inventory – a big 2-3% increase
"Implementation of the Wetlands Supplement…converts the LULUCF [land] sector…from a net sink to a net source in all years"
assets.publishing.service.gov.uk/government/upl…
"Implementation of the Wetlands Supplement…converts the LULUCF [land] sector…from a net sink to a net source in all years"
assets.publishing.service.gov.uk/government/upl…

This update is somewhat artificial:
It reflects a change in our understanding of emissions from peat, rather than a change in the emissions
But it nevertheless reveals a problem we didn't think we had, with the land sector being an emissions source, rather than a carbon sink
It reflects a change in our understanding of emissions from peat, rather than a change in the emissions
But it nevertheless reveals a problem we didn't think we had, with the land sector being an emissions source, rather than a carbon sink
The inventory change also highlights land management practices linked to peatland carbon emissions, including plantation forestry on drained peat – and the huge loss of peat under large swathes of agricultural land
https://twitter.com/seftongeo/status/877459421114359813
(As an aside – palm oil plantations in Malaysia or Indonesia are rightly criticised when they are planted on drained peat. But worth remembering we in UK already drained a lot of our peat to use it for farmland. Not so different – just different timing)

While there's been pretty limited progress since 1990, to look on the bright side, our improved understanding of peatland carbon does show ways we could cut UK emissions, by changing land management practices
uk-air.defra.gov.uk/assets/documen…
uk-air.defra.gov.uk/assets/documen…

For the history buffs:
These inventory changes have been in the works since 2013 and were taken into account in the latest @theCCCuk advice in December, on the 6th carbon budget for 2033-2038 – and on how to reach net-zero
theccc.org.uk/wp-content/upl…
These inventory changes have been in the works since 2013 and were taken into account in the latest @theCCCuk advice in December, on the 6th carbon budget for 2033-2038 – and on how to reach net-zero
theccc.org.uk/wp-content/upl…

The changes stem from a 2013 IPCC report on greenhouse gas emissions from wetlands, a rip-roaring 354-page opus…
(this report points back even further in time, to a 2010 expert meeting in Geneva - let's not go there)
ipcc.ch/publication/20…
(this report points back even further in time, to a 2010 expert meeting in Geneva - let's not go there)
ipcc.ch/publication/20…

…the govt went on to commission research on how to apply the changes to the UK's emissions inventory, way back in 2014
data.gov.uk/data/contracts…
data.gov.uk/data/contracts…
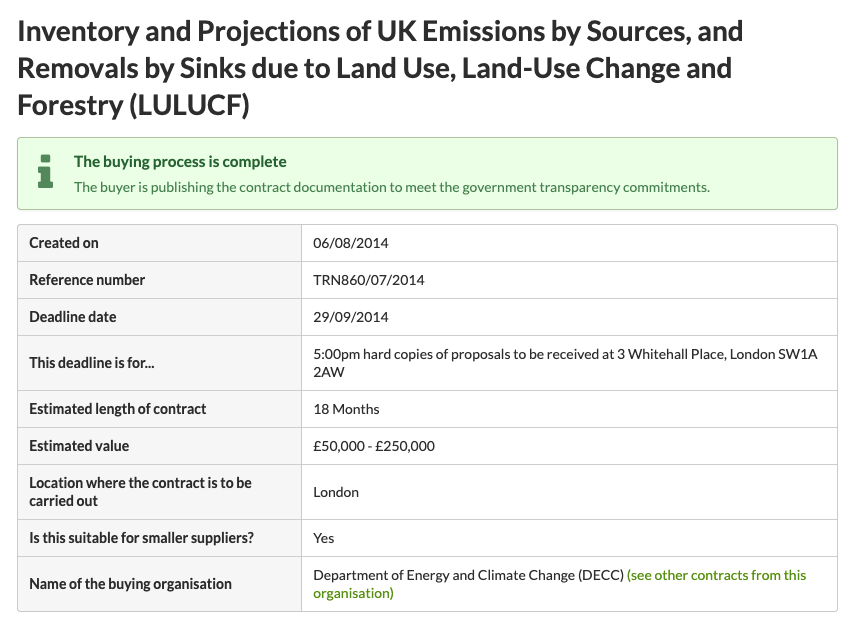
…and that research reported back to govt in 2017
Notably, it found significant peatland emissions due to farmland and plantation forestry on drained peat
Surprisingly, these are far bigger problems in GHG terms than peat cutting for horticultural use
uk-air.defra.gov.uk/assets/documen…
Notably, it found significant peatland emissions due to farmland and plantation forestry on drained peat
Surprisingly, these are far bigger problems in GHG terms than peat cutting for horticultural use
uk-air.defra.gov.uk/assets/documen…

…anyway, the changes finally made their way it into the UK's emissions inventory this year
"In this year’s publication, a major change has been made to better represent emissions from drained and rewetted inland organic soils (peatlands)"
assets.publishing.service.gov.uk/government/upl…
"In this year’s publication, a major change has been made to better represent emissions from drained and rewetted inland organic soils (peatlands)"
assets.publishing.service.gov.uk/government/upl…

Here's a link to the updated inventory, which confusingly doesn't mention any of this
(thanks @david_joffe for pointing towards the methodology report, linked earlier in thread)
gov.uk/government/sta…
(thanks @david_joffe for pointing towards the methodology report, linked earlier in thread)
gov.uk/government/sta…
NB there are further significant updates in the pipeline for the UK's emissions inventory, including an update to the "global warming potential" of methane and nitrous oxide, which will also raise the UK total
• • •
Missing some Tweet in this thread? You can try to
force a refresh