1/ Chart study from the Dragon's Den. Bank index first. $BKX
2/ Weekly. Major RSI spikes catch significant highs and lows leading to pauses or more likely, reversal. Large ABC pattern looks complete. B wave classic flat. Image
3/ $BKX ABC-X-ABC zigzag since Oct is pretty clean. B waves channel perfectly for textbook structure. Not much more to go. Image
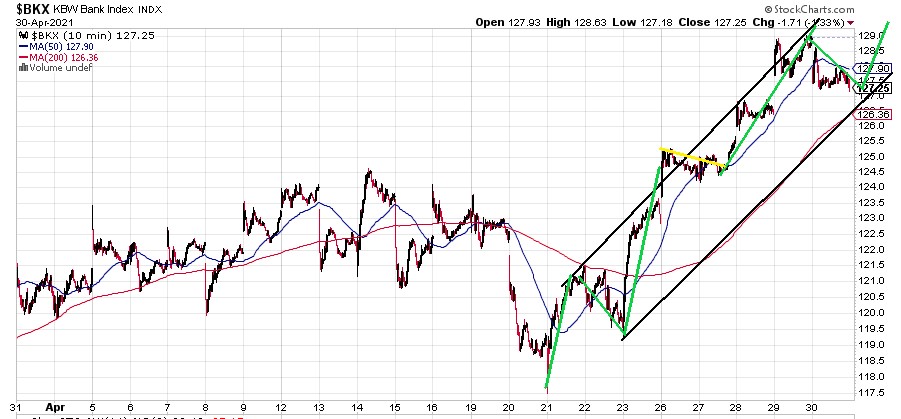
4/ $BKX short term. Final leg since Apr 21 also looks like an ABC-X-ABC with B in perfect channel. Missing on more up move and that's it. Image
5/ Commodities red hot lately. But we al know parabolas don't last forever. Perfect channel tag which lines up exact with 2009 low. Brief inflationary spike here to be follow by deflationary collapse. Kondratieff winter around the corner. Image
6/ Sorry $GOLD bugs. Kondratieff winter is a deflationary collapse across the board and this has probably already topped. No safe haven. Wedge in process for next down leg to come. Image
7/ Eventually $GOLD will in fact shine, but not for a while. Major ABC corrective and we have only just begun the C. Image
8/ $NDX This one still looks like it might need a final 5th up too. Image
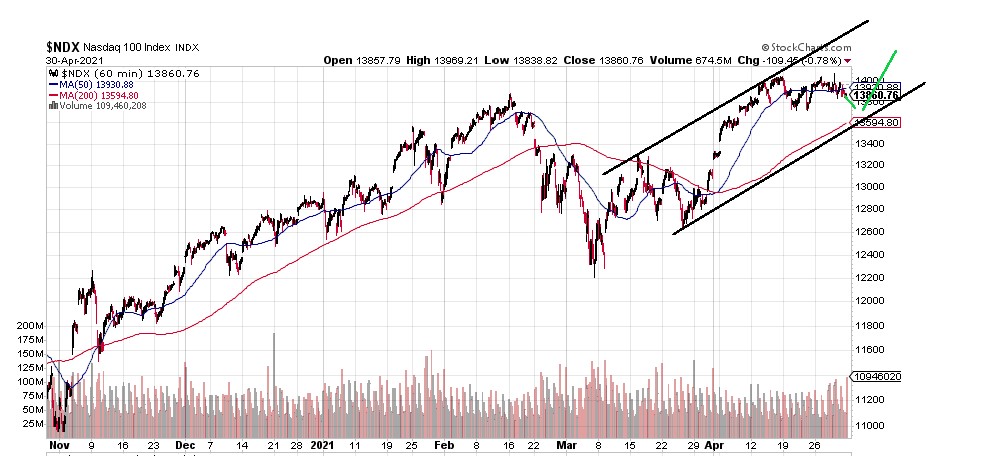
9/ On a weekly basis, MACD hasn't been this high since 2000 and the current one is giving us a warning that momentum is dying. Image
10/ $VIX Bottomed a few years ago and has been showing higher lows since. If next is at hand, it correlates to one more VIX crush to the trendline and thus, one more surge or 5th higher for indices. Image
11/ In the big picture, the Value Line Index really gives a clear picture of what has been going on for last 20 years. Giant corrective flat with B almost done. C down will wipe out a lot. See the red 'c' down in the first A? The coming C down is 1 degree higher form. Image
12/ I have said it before. People should be running from this one. The ARKK is going to sink major. This is classic bear triangle and I have proprietary data analysis that is 100% in agreement. Needs just a little more slosh to finish before it dumps. Image
13/ Target for $ARKK is about $85-90, the center point of the prior rally consolidation. Note volume spike on reversal and now dramatic falling volume on the triangle. All textbook correlation. Cathy got cocky and is now going to get smacked for it. Image
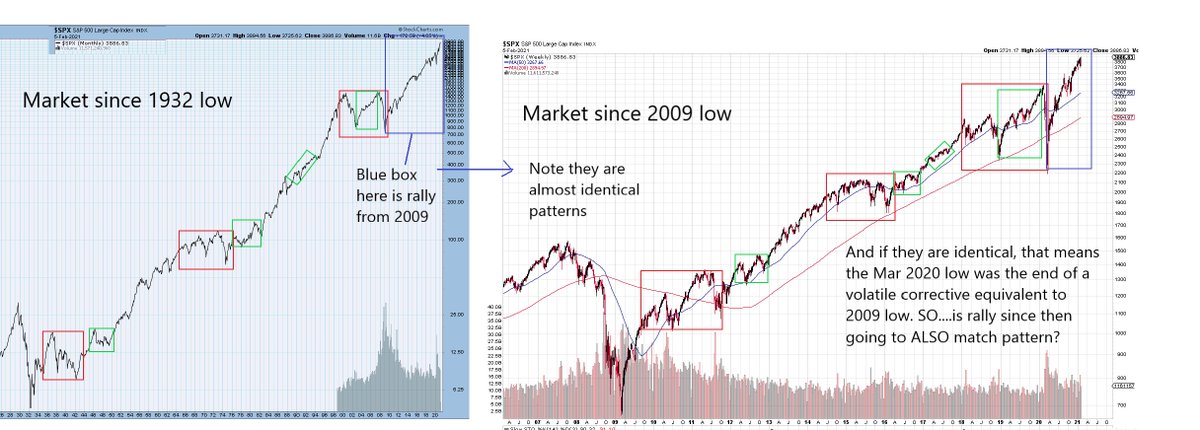
14/ How do we know we are in the end game in the BIG picture? We are nesting. This is almost spooky to look at. The market from 1929 to now looks EXACTLY like 2009 to now. Image
15/ If nesting holds, let's look at market from 2009 to now and from Mar 2021 to now. Keep in mind, the smaller the time frame, the more "noise" is introduced so we're looking for similar structural elements. Result? WHOA!! Image
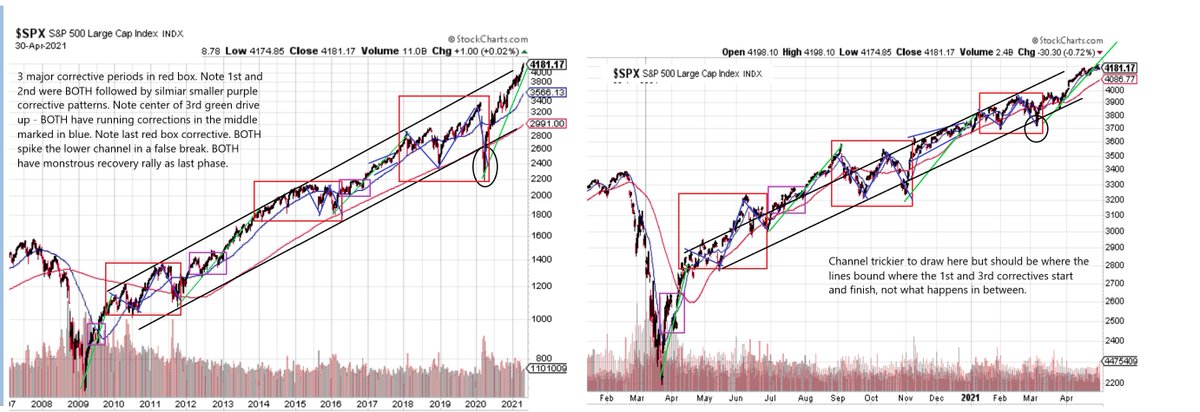
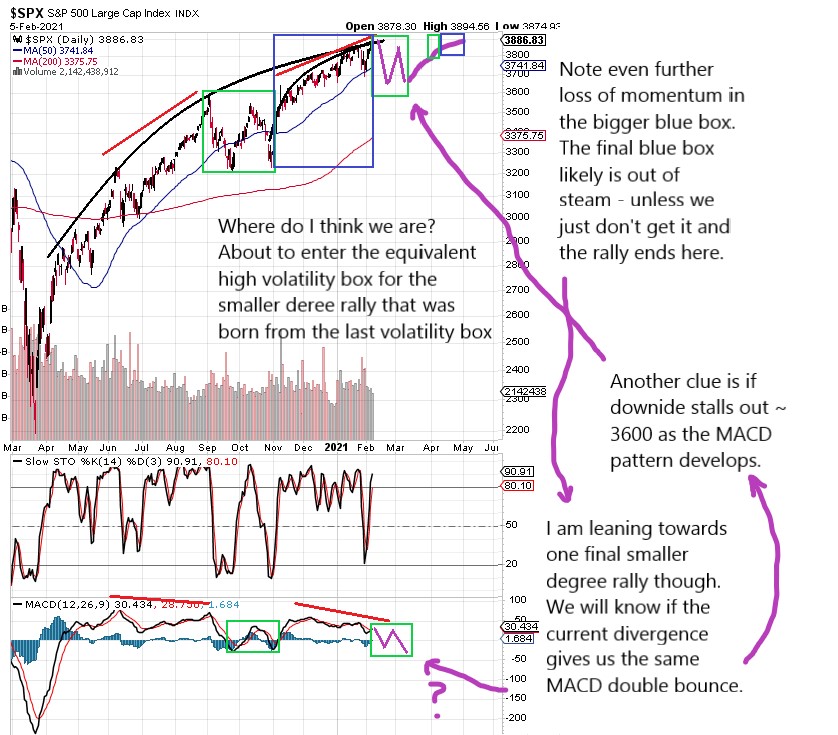
16/ So, assuming nesting continues, early Mar to now should ALSO be the same pattern. Remember, smaller time frame, more NOISE, so it starts to look hazy. I *think* we are in the midst of the last red box phase which means we have a fast steep drop ahead, and then final surge Image
17/ Interestingly, this all correlates highly to many individual stocks looking like they are in 4th wave and still need a 5th.
18/ The final surge to come should also look like the larger nested patterns but even more noise so it will look sloppy. As time frame drops, the middle red box becomes less prominent. It was almost gone in the last time frame just shown and looks more like 5 waves, not ABC-X-ABC
19/ Within the ABC-X-ABC the "C-X-A" part is all really a 3rd wave anyway, just split with a pause in the middle and this pause seems to be disappearing in smaller time frames. Safe to say we are out of time for any smaller nests after the next one
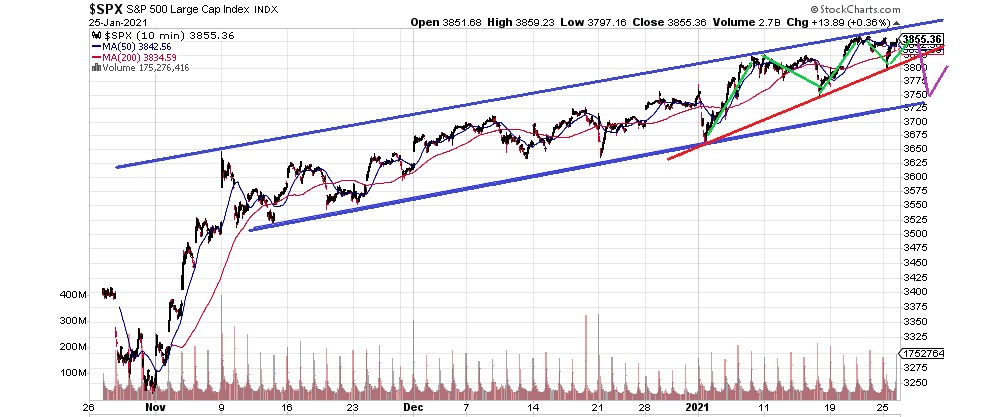
20/ If we are where I think we are, we should see a fast 5 wave decline that punctures the lower black channel, but recovers to new highs, ~4250-4300, over the next 1-2 weeks to finish it all. Image
21/ If the decline is smaller, doesn't reach the lower channel, and slower overall and looking like it ill unfold in 3 waves, then we are more likely in the middle red box region of the nested structure and have an extra few weeks to go.
22/ China looking rather interesting too here. Also in a 4th of a wedge with final 5th before drop to an even larger triangle boundary. Question is, does the boundary hold or is wedge the C wave of a corrective between 2016 and now? Image
23/ That's all for the chart study for now

• • •

Missing some Tweet in this thread? You can try to force a refresh
 

Keep Current with Puff Dragon

Puff Dragon Profile picture

Stay in touch and get notified when new unrolls are available from this author!

Read all threads

This Thread may be Removed Anytime!

PDF

Twitter may remove this content at anytime! Save it as PDF for later use!

Try unrolling a thread yourself!

how to unroll video
  1. Follow @ThreadReaderApp to mention us!

  2. From a Twitter thread mention us with a keyword "unroll"
@threadreaderapp unroll

Practice here first or read more on our help page!

More from @PuffDragon11

17 Mar
1/ You don't have to trade every day to make good money. In fact, shorter term time frames can actually be more challenging because signals are influence by higher time and lower time frames. Let things line up and take the few trades that REALLY skew things in your favor.
2/ Commodities are about to hit a brick wall. Everyone says inflation. NO!! Weeklies are awesome for long term. Line up RSI and buyer/seller ADX spikes for best results. Throw in some trend lines which correlate and you have a perfect set up.
3/ Time frames are absolutely critical. Buyer/seller or RSI spikes on the monthly may be good for more than a year. Weekly for 6-12 months. Daily for 1-4 months. 60 min - 1-3 weeks. Don't overplay signals
Read 8 tweets
8 Feb
1/ Chart Study from Dragon's Den. Been a while, but this is just a short one. Let's start with the BIG picture. Entire rally from 1932 and rally from 2009 are IDENTICAL. It's a nested pattern
2/ So if nesting, the rally from Mar 2020 low should again be like pattern from 2009. Just one degree smaller. I think it is close.
3/ Here is a close up of move from 2020. Same pattern but one difference. We are losing momentum. Do we have one more smaller cycle left? Maybe
Read 10 tweets
26 Jan
1/ Futures down tonight. 2 things. 1) I don't like big gaps near the high. Odds favor it is recovered. 2) No break until the lower blue line breaks. As long as the gap down stays above this, watch for rally to fill gap.
2/ That said, this is the final segment in the wedge and there is likely a lot of overlap but no more than 3 clear waves. once gap fills, that may be it so a terminal end is upon us.
3/ Once the lower wedge breaks though, next should be the lower parallel line here. We are seeing downside moves appear swiftly and this may continue to hold true with little time to react. I suspect that lower lines proves to be another bounce point tho.
Read 4 tweets
26 Aug 20
1. Want to see what happens to irrational markets? In 1999-2000, the NDX went a little more than double over the span of 5 months. When it turned, 25% was lost in 7 trading days. After a strong bounce, it dropped again losing overall 35% in 3 weeks.
2. After another longer bounce and drop, the total was 40% down. It managed to recover ~62% of that in the months that followed.
3. BTFD crowd rejoiced that we are off again - not knowing that 2 years later the index would lose 85% of it's value.
Read 7 tweets
17 Jul 20
1/ Seriously. I post what I believe and I have extremely high confidence in what I see. I will emphasize - I AM NOT A DAYTRADER. I don't give a sh*t what the market has done in the last few weeks, whether I am early, blah, blah...
2/ Read my pinned post - I do not give advice and YOUR trade plan will probably not match mine.
3/ If you disagree fine. But if you're going to be a d*ck because the market went up and my LONG term prognosis is another depression, we're looking at 2 different times frames.
Read 5 tweets
21 Jun 20
1/ Chart study from Dragon's Den. This is the big picture. It has absolutely NOT changed at all and my guide for next 2-3 years. Image
2/ The 3 peaks pattern is the true market nesting pattern. In the last big picture chart, we see that 2000-2009 was a giant ABC corrective. Going one step bigger, 2000 - now is also a giant ABC but we have only just begun the C.
3/ In some ways, that will make the coming decline as well as the 2007-2009 decline similar in terms of pattern and character. It won't be 100% as the market has ways of making things a bit dynamic but the overall arch should be similar.
Read 10 tweets

Did Thread Reader help you today?

Support us! We are indie developers!


This site is made by just two indie developers on a laptop doing marketing, support and development! Read more about the story.

Become a Premium Member ($3/month or $30/year) and get exclusive features!

Become Premium

Too expensive? Make a small donation by buying us coffee ($5) or help with server cost ($10)

Donate via Paypal Become our Patreon

Thank you for your support!

Follow Us on Twitter!