#Bitcoin update
1/21
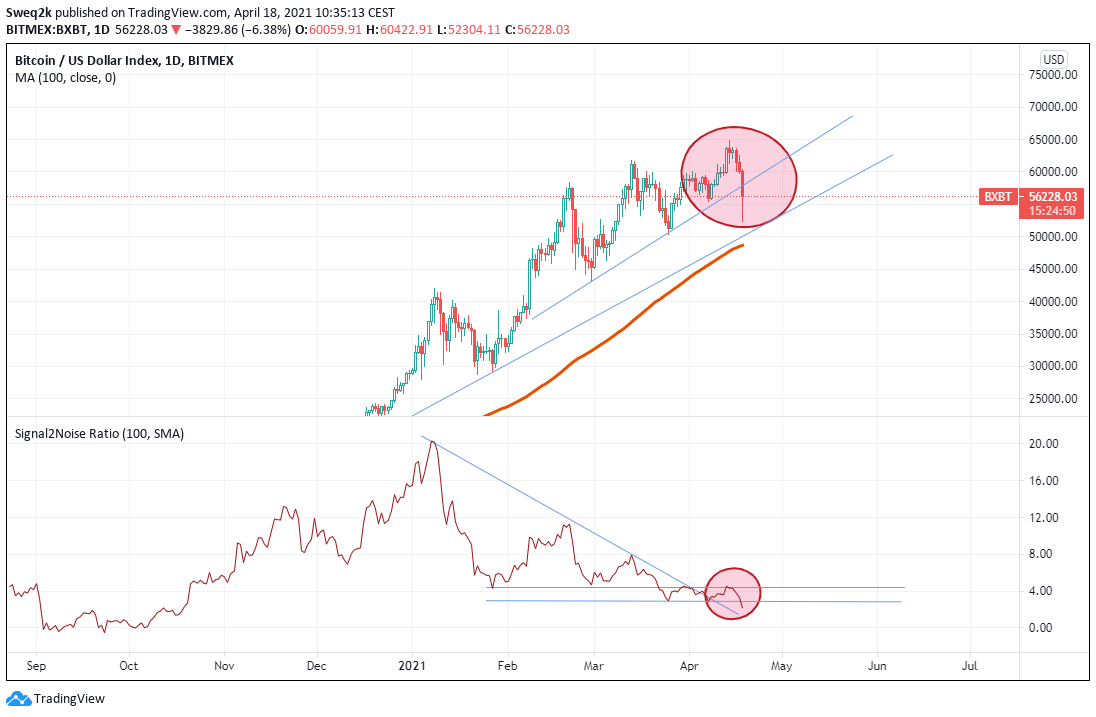
USD 300k per #Bitcoin is possible according to this ratio.
I usually try to avoid price predictions, but next to my S2N-Ratio that also points towards a potential price of 300k, this simple long-term chart confirms this as well.
1/21
USD 300k per #Bitcoin is possible according to this ratio.
I usually try to avoid price predictions, but next to my S2N-Ratio that also points towards a potential price of 300k, this simple long-term chart confirms this as well.
2/21
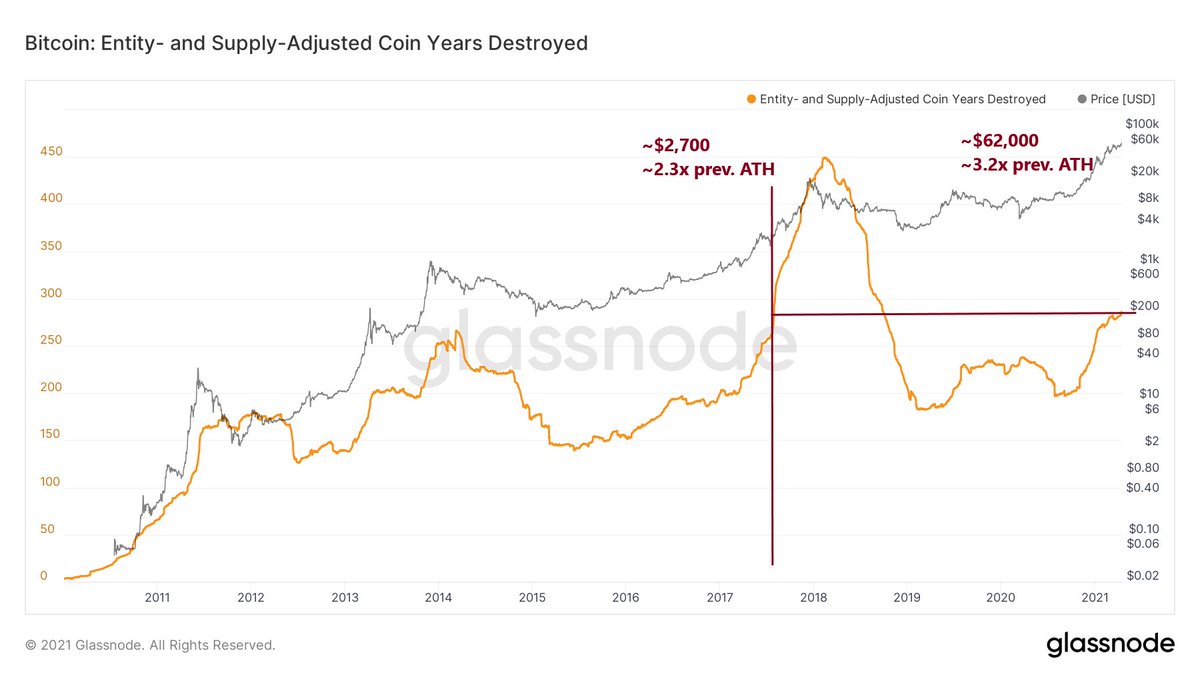
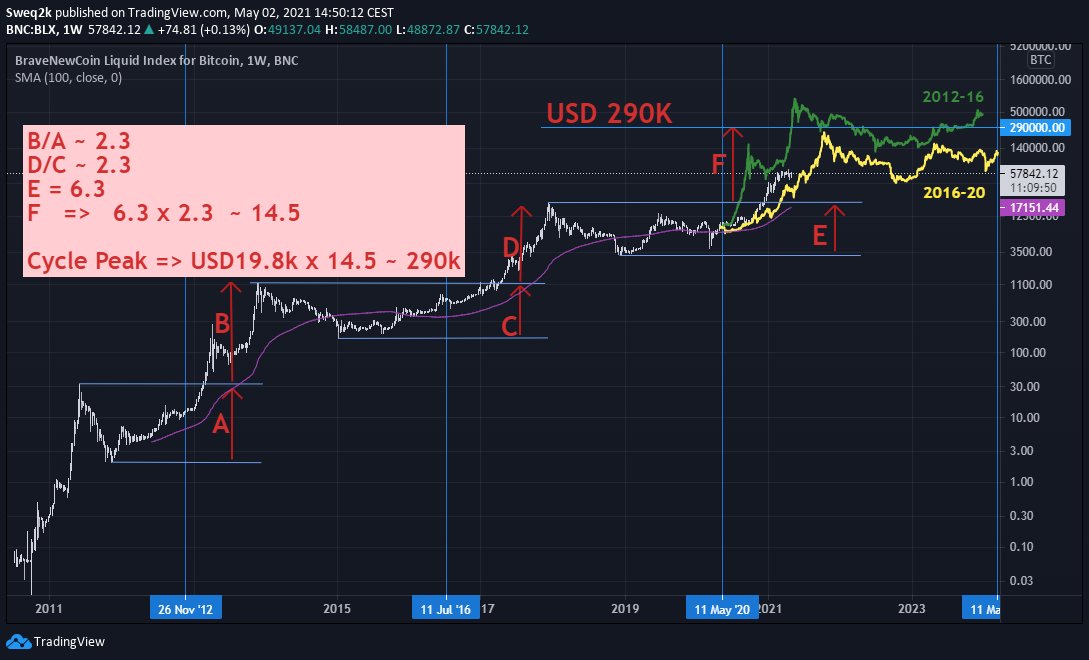
The chart shows ratios of 1) the return from the low of a cycle to the previous peak and 2) the return from the previous peak to the new cycle peak. E.g. for previous cycle: low to 2014 peak (C): 7.2x return and 2014 peak to new 2017 peak (D): 16.8x return. 16.8/7.2 = 2.3.
The chart shows ratios of 1) the return from the low of a cycle to the previous peak and 2) the return from the previous peak to the new cycle peak. E.g. for previous cycle: low to 2014 peak (C): 7.2x return and 2014 peak to new 2017 peak (D): 16.8x return. 16.8/7.2 = 2.3.
3/21
Interestingly, the ratio for the last two cycles has been 2.3 in both cases. Of course with only two data points the potential for generalization is limited. But after thinking about it, it is actually like a ratio for risk/return from a long-term fully-cycle perspective.
Interestingly, the ratio for the last two cycles has been 2.3 in both cases. Of course with only two data points the potential for generalization is limited. But after thinking about it, it is actually like a ratio for risk/return from a long-term fully-cycle perspective.
4/21
What do I mean by that? Take the Sharpe Ratio for example, it is return divided by risk. Risk can be standard deviation as for the Sharpe Ratio but there are also other risk measures, such as maximum drawdown.
What do I mean by that? Take the Sharpe Ratio for example, it is return divided by risk. Risk can be standard deviation as for the Sharpe Ratio but there are also other risk measures, such as maximum drawdown.
5/21
That is actually what this ratio is about. The return from the cycle low to the previous peak is the recovery from the drawdown that is needed to be break even vs. the last cycle peak. It therefore reflects the "risk" and accordingly the denominator of the return/risk ratio.
That is actually what this ratio is about. The return from the cycle low to the previous peak is the recovery from the drawdown that is needed to be break even vs. the last cycle peak. It therefore reflects the "risk" and accordingly the denominator of the return/risk ratio.
6/21
The return until the new high is then actually the max return based on the previous cycle high and is the numerator of the return/risk ratio.
The return until the new high is then actually the max return based on the previous cycle high and is the numerator of the return/risk ratio.
7/21
The maximum drawdown in 2015 from the 2013 cycle peak was 94%! That is staggering. The drawdown in 2018 was 86%. Sounds not like a big difference, but to recover from these lows the return needed is c. 16x vs. "only" 7x. Actually this difference is massive.
The maximum drawdown in 2015 from the 2013 cycle peak was 94%! That is staggering. The drawdown in 2018 was 86%. Sounds not like a big difference, but to recover from these lows the return needed is c. 16x vs. "only" 7x. Actually this difference is massive.
8/21
The higher risk (drawdown) in 2013 was awarded with a 37x return after the previous cycle top was reached vs. "only" 17x in 2017.
The higher risk (drawdown) in 2013 was awarded with a 37x return after the previous cycle top was reached vs. "only" 17x in 2017.
9/21
The good news is that the last drawdown was almost the same in the previous cycle with 84% instead of 86%. Until the 2017 peak we made 6.3x, which means that we can make 14.5x (2.3x6.3) from the previous high, which brings you to almost USD300k per #Bitcoin!
The good news is that the last drawdown was almost the same in the previous cycle with 84% instead of 86%. Until the 2017 peak we made 6.3x, which means that we can make 14.5x (2.3x6.3) from the previous high, which brings you to almost USD300k per #Bitcoin!
10/21
300k per #Bitcoin. Let this sink in. It sounds almost impossible - but exponential growth is hard to grasp and who thought that we will so fast go to 60k when we were at 10k. I'm also sure that in past cycles many have underestimated #Bitcoin's potential.
300k per #Bitcoin. Let this sink in. It sounds almost impossible - but exponential growth is hard to grasp and who thought that we will so fast go to 60k when we were at 10k. I'm also sure that in past cycles many have underestimated #Bitcoin's potential.
11/21
Ok, one could now argue that a maximum drawdown and peak are influenced by very extreme points/events in time and the question is whether that is appropriate in a risk / return framework.
Ok, one could now argue that a maximum drawdown and peak are influenced by very extreme points/events in time and the question is whether that is appropriate in a risk / return framework.
12/21
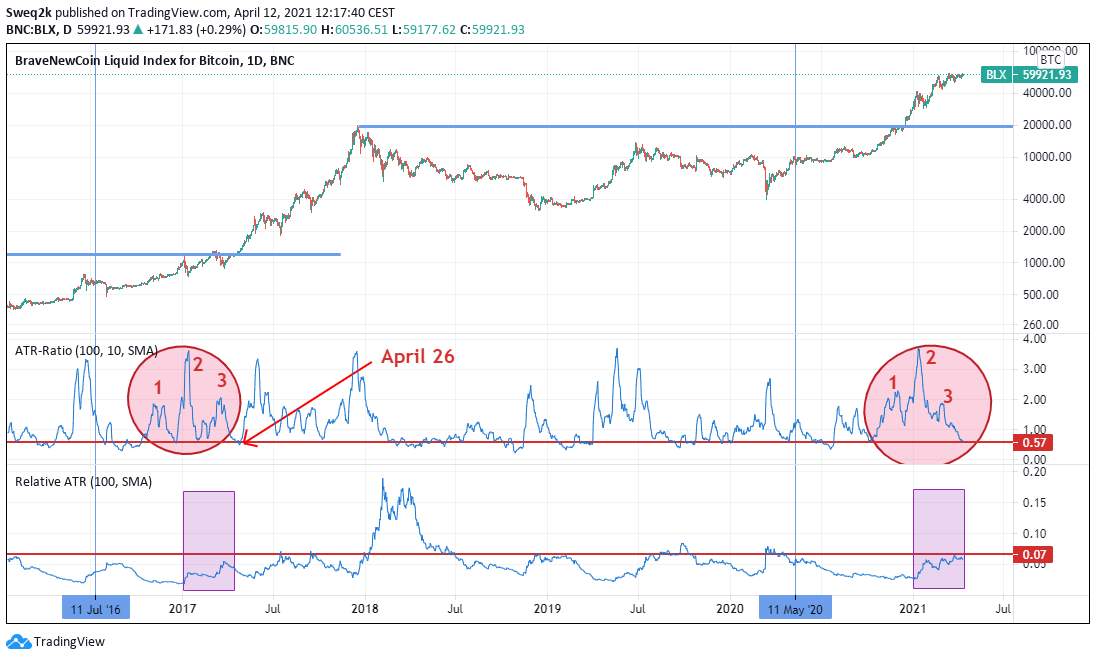
In order to go above 250k, we would essentially have a similar cycle than in 2017. As risk and return are interlinked, we can have an alternative look at the volatility of #Bitcoin.
In order to go above 250k, we would essentially have a similar cycle than in 2017. As risk and return are interlinked, we can have an alternative look at the volatility of #Bitcoin.
13/21
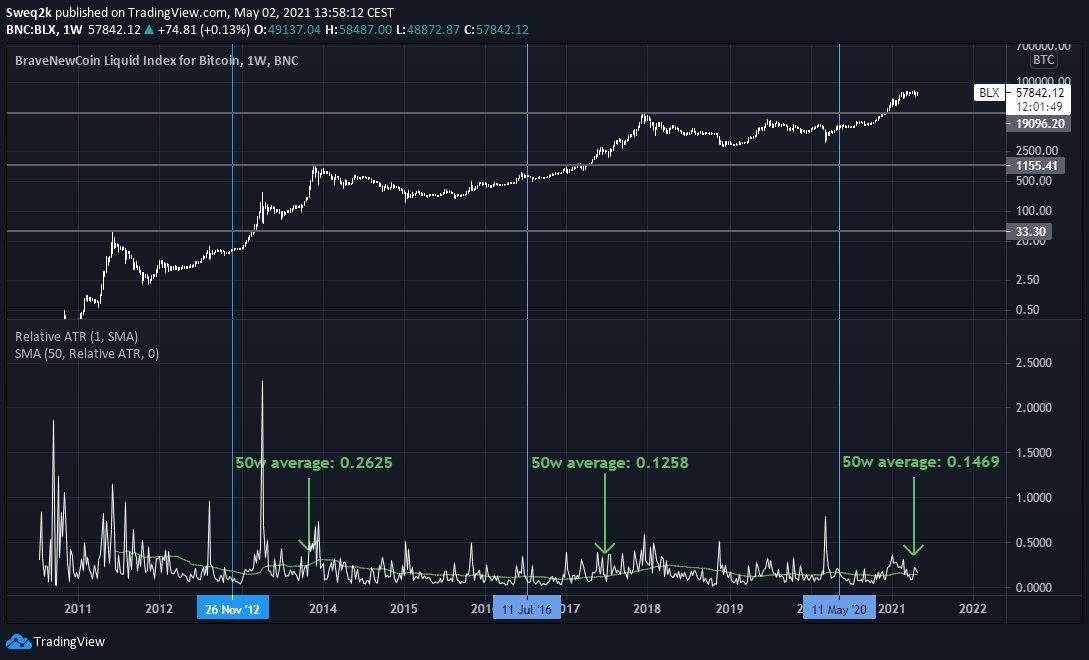
This chart shows the weekly ATR relative to the price and the 50week average. Since the latest halving we are roughly 50 weeks into this cycle so the average measures this period in this cycle. It is actually higher compared to 2017.
This chart shows the weekly ATR relative to the price and the 50week average. Since the latest halving we are roughly 50 weeks into this cycle so the average measures this period in this cycle. It is actually higher compared to 2017.
14/21
And not only is the volatility higher, also when you compare the cycle graphs from previous cycles in the previous chart, we are currently ahead of the 2017 cycle.
And not only is the volatility higher, also when you compare the cycle graphs from previous cycles in the previous chart, we are currently ahead of the 2017 cycle.
15/21
Looking at the volatility over time, since 2015 it looks relatively stable whereas the periods before have seen clearly more extreme events, esp. in the shorter term.
Looking at the volatility over time, since 2015 it looks relatively stable whereas the periods before have seen clearly more extreme events, esp. in the shorter term.
16/21
As mentioned before, I think the volatility over time will decrease further as the market matures and the market cap increases, but so far - irrespective of which measures I look at - I cannot see a material decline in volatility compared to 2017.
As mentioned before, I think the volatility over time will decrease further as the market matures and the market cap increases, but so far - irrespective of which measures I look at - I cannot see a material decline in volatility compared to 2017.
17/21
The smaller interim drawdowns in this cycle have been slightly less severe compared to 2017 but this could also be based on better more liquid markets and looks less so when looking just at weekly volatility data as in the chart.
The smaller interim drawdowns in this cycle have been slightly less severe compared to 2017 but this could also be based on better more liquid markets and looks less so when looking just at weekly volatility data as in the chart.
18/21
As so far no material decline in volatility compared to 2017 seems to happen, I also do not see why we should not repeat the same returns as in 2017.
As so far no material decline in volatility compared to 2017 seems to happen, I also do not see why we should not repeat the same returns as in 2017.
19/21
Therefore, as simple the above ratio might seem, if one looks a bit deeper into the development of volatility we find confirmation for this view.
Therefore, as simple the above ratio might seem, if one looks a bit deeper into the development of volatility we find confirmation for this view.
20/21
Maybe 2.3x becomes #Bitcoins "Golden Ratio" ;-) I would never base my investing on just a few data points, but I certainly find this relationship interesting and it is now another way next to e.g. S2F, my Signal2Noise ratio or on chain data, showing that +250k is possible.
Maybe 2.3x becomes #Bitcoins "Golden Ratio" ;-) I would never base my investing on just a few data points, but I certainly find this relationship interesting and it is now another way next to e.g. S2F, my Signal2Noise ratio or on chain data, showing that +250k is possible.
21/21
The potential return up to 300k was also backed based on my Signal2Noise ratio, which I publish regularly and have explained in detail here:
The potential return up to 300k was also backed based on my Signal2Noise ratio, which I publish regularly and have explained in detail here:
https://twitter.com/2210ft/status/1376172867621126146?s=20
• • •
Missing some Tweet in this thread? You can try to
force a refresh