on Apr 16, as Science Table proclaimed doom, Ontario govt adopted annoying but irrelevant outdoor rules. To universal condemnation by Ontario media and COVID establishment for being inadequate and irrelevant. @fordnanation was right not to over-react to SciTable doomcasting.
2/ as on previous occasions, Ontario Science Table's projection was wildly wrong. In only 2 weeks, actuals are at 50% of levels predicted under the draconian measures not adopted and 25% of predictions under "weak" (not exactly) measures that @fordnation continued.
3/ although cases are a fraction of Science Table predictions, hospitalizations and ICU remain high (in Ontario terms). While SciTable like to point to some prior forecasts of high ICU levels, such forecasts were tied to forecasts with MUCH higher case numbers than experienced
4/ on Feb 25, SciTable projected case range from slow decline to incipiebt 3rd wave. Unusually, actuals fit one of their scenarios (medium). They predicted reduced ICU occupancy, presumably reflecting case decline in previous 8 weeks. This didn't happen.
5/ ICU occupancy remained stubbornly high in late Feb/Mar, defying SciTable predictions of decline. Rather than SciTable giving prescient advice to Ontario govt on ICUs, their advice was diametrically wrong on ICU occupancy at given case rates.
6/ what appears to have been happening was that 2nd/3rd wave was less lethal (deaths went down), but, perhaps as a result of lower lethality, caused longer and greater ICU occupancy per case than contemplated in SciTable models.
• • •
Missing some Tweet in this thread? You can try to
force a refresh
on Jan 12, Ontario Science Table projected up to 41,000 COVID cases by Feb 14, but only 1500 ICU beds needed. In recent third wave, we're up to almost 900 ICU beds with less than 10% of the cases.
2/ despite pompous Sci Table self-advertisement, their projections, up until the last few minutes, gave no hint of ICU to case ratio that we're presently experiencing.
3/ here's a way of looking at forecasts that intrigues me. There was almost linear relationship between Jan 12, 2021 projections of cases and ICU on any given date - Feb 14 values shown as points below and joined. Black +s show actuals.
Ontario COVID academics are in full throttle partisanship against Ontario govt for being insufficiently draconian in placing burdens and worse lockdowns on struggling private sector (while public sector privilege paychecks uninterrupted) But looks like Gompertz top on third wave
I'm pretty optimistic about May cases.
Actual cases have fallen sharply for a few days after a 2-week plateau - very Gompertz - and are already less than 50% of Science Table Apr 16 predictions, despite govt not caving to most extremist academics - to their fury.
Also, last year, cases, deaths and hospitalizations all fell sharply in May and June in Ontario as people get more fresh air and sunshine. Hopefully this year as well.
in Ontario, politically partisan scientists e.g. Fisman, Stall, vehemently criticize provincial vaccinations while singing hosannas to federal govt. Unscientifically, they never show comprehensive data (which isn't as transparent as desirable.) Here are administered and received.
2/ on April 5+- day or so, Ontario received catchup shipments for first quarter orders plus large shipment of slow moving AZ. Shipment in subsequent 3 weeks have been MUCH lower.
3/ Ontario received no/negligible vaccines for 3 key weeks in February during which, by coincidence or not, third wave got a foothold and had to lay off vaccine workers as no supply. Since then, distribution increased rapidly and exponentially. Last week reached 130K weekdays
Ontario did much better on COVID cases and deaths than ANY lower 48 US state and, AFAIK, any European nation, despite Canada getting vaccines late due to federal govt, not Ontario. Ford has handled crisis with dignity and deserves credit, not blame. washingtonpost.com/opinions/2021/…
2/ to show just how well Ontario has actually done, here are charts comparing daily New Cases and Deaths for Ontario relative to neighboring Michigan, Florida and, in Europe, France. Ontario has done much better. Similar with every other jurisdiction in lower 48 US and Europe.
3/ Ontario science advisory panel projected 100 deaths per day in March-April. Actual results are far lower than even the most optimistic projections, much better even than 97.5% percentile optimistic. Yet partisan Ontario media fails to credit Ford for this accomplishment.
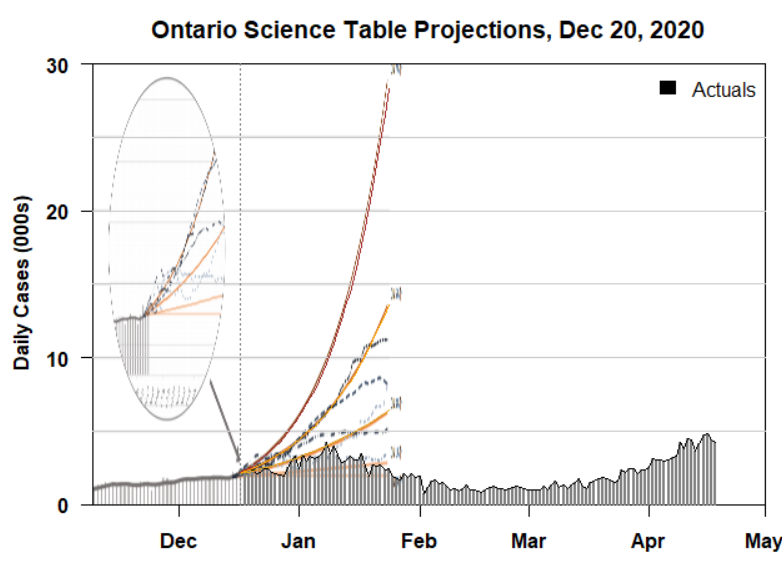
as relentlessly partisan Ontario spew hate at Ontario government, let's re-examine actual results vs Science Table projections of Dec 20, 2020 at start of winter. They projected 7500-30000 cases by late January and increasing exponentially.
Looking back at dire projections of Dec 20, 2020, if Science Table would surely have said that our ultimate actuals were a hugely optimistic projection. And that reaching such an optimistic projection would be an accomplishment.
between December and now, Science Table has re-jigged the scale of their graphics so that the recent case increase looks much bigger than it appears against their original Dec 2020 projections which launched the present lockdown.
an excellent response to partisan and almost entirely unfounded criticism of Ontario vaccination program by prominent commenters @DFisman of U of Toronto, @NathanStall and Toronto Star. They whinge about "freezers" and supposedly chaotic vaccine distribution, fomenting hate.
2/ turns out that the slow-moving inventory, about which Fisman, Stall and TorStar whinge, is AstraZeneca, about which segments of medical community itself, in particular, regulators, have fomented doubt.
3/ turns out we have no Pfizer inventory other than that required to convert one weekly delivery into daily clinics. And that Moderna shipments erratic. We recently ran out.