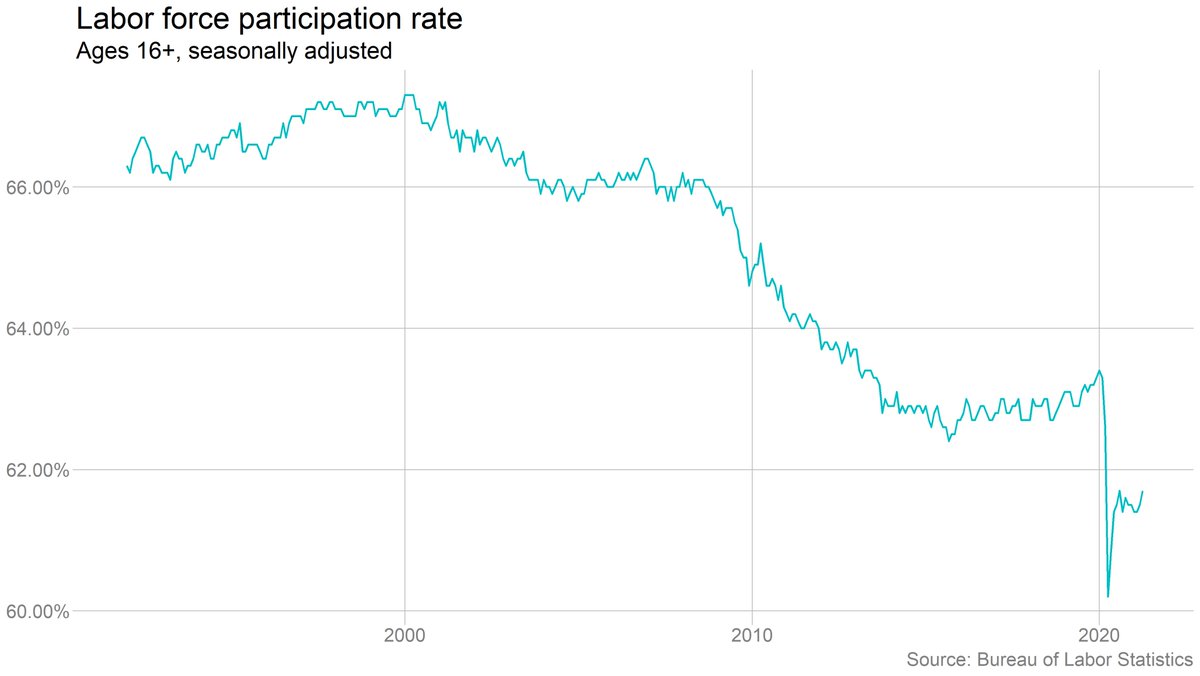
Honestly, at first glance I have no idea what to make of the jobs report. Not just that it was weak, but the particular way it was weak, is perplexing. So come with me as I try to work through it the only way I know how -- with charts!
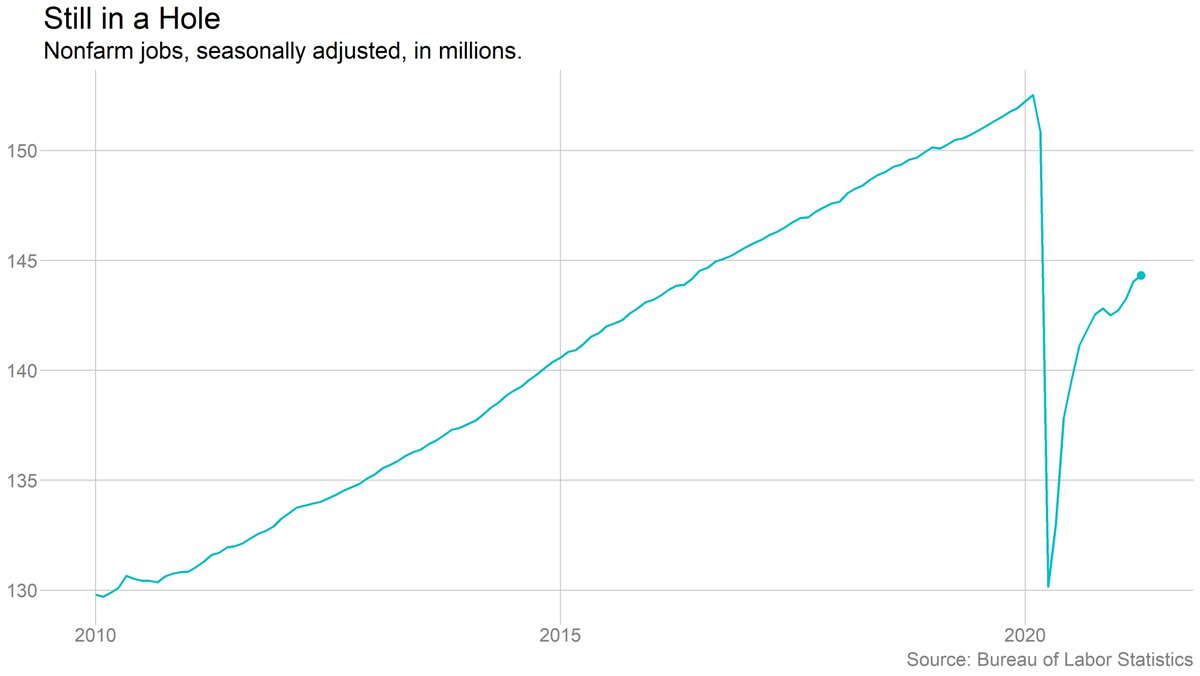
First, the obvious: The jobs gains in April were disappointing, and leave us in a deep hole. We're still 8.2 million jobs below where we were in Feb. 2020. 
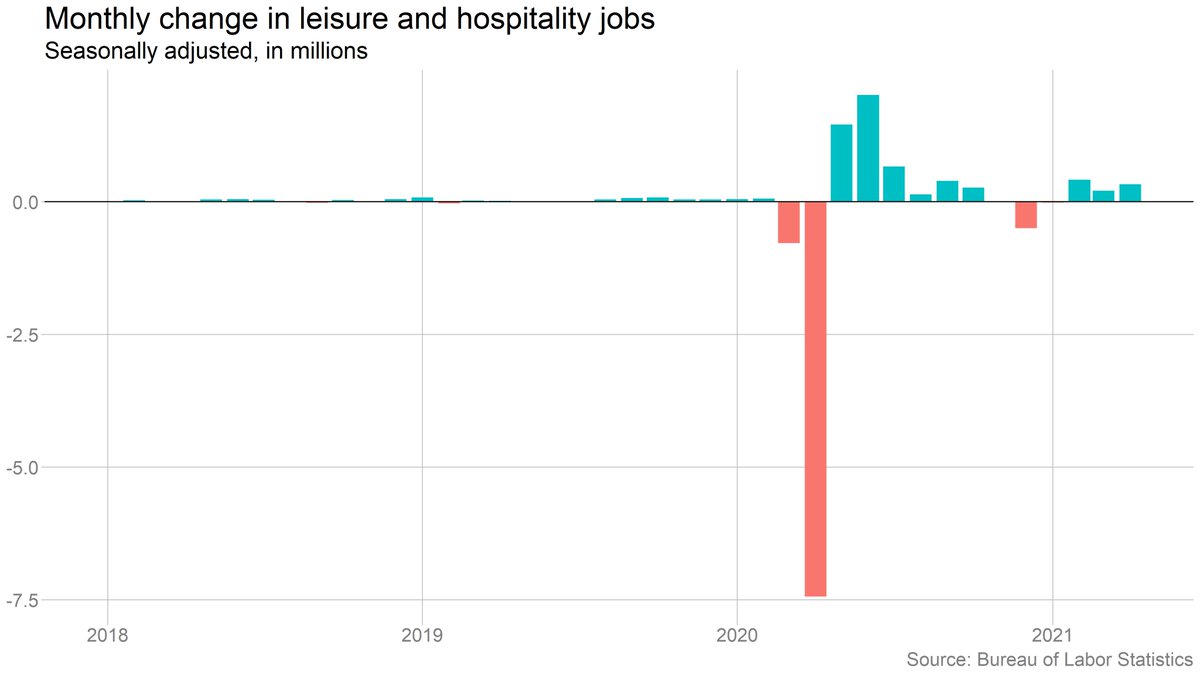
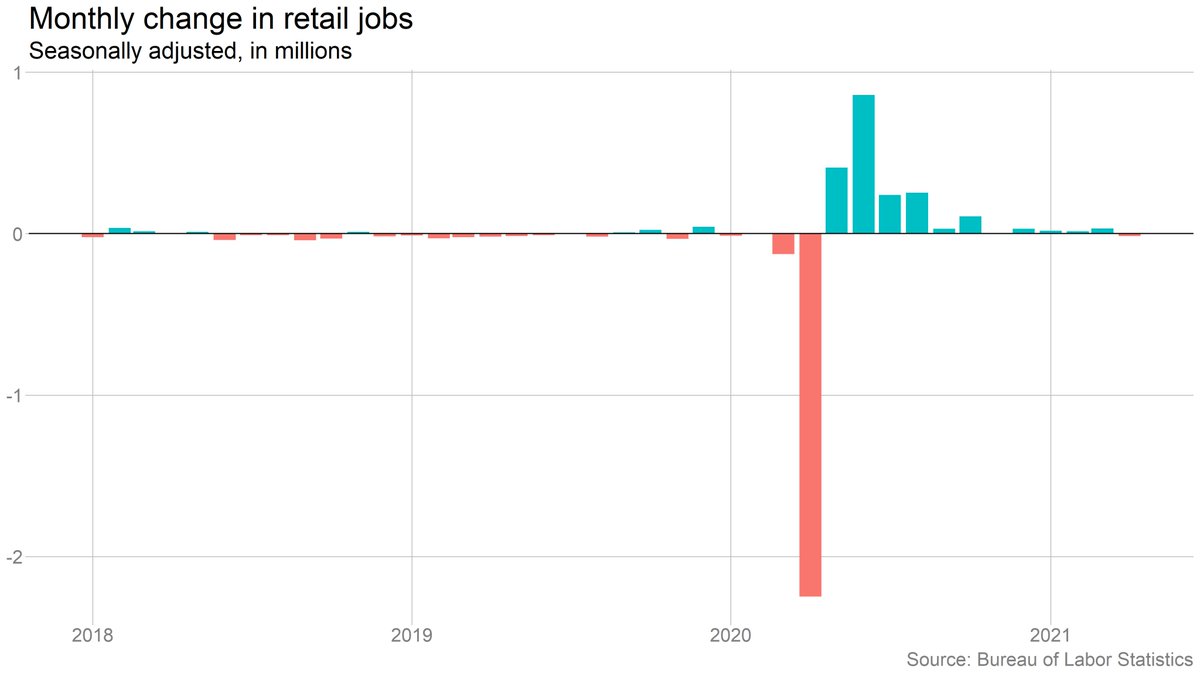
The obvious first thought is "labor shortage!" And I don't dismiss that out of hand. But the industry breakdown doesn't immediately line up with that. Leisure & hospitality (where we've heard the biggest complaints about lack of workers) actually did fine. 
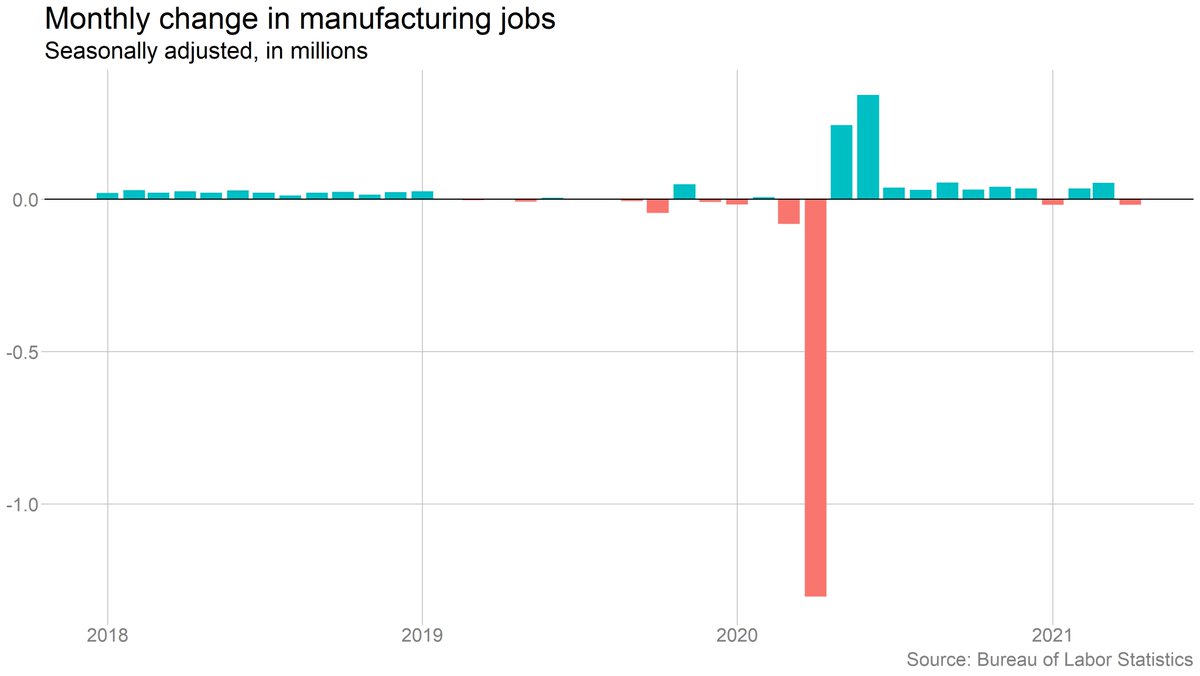
Manufacturers cut jobs, which could be about chip shortages, etc. Transportation/warehousing could be about shift back to in-person. Temp jobs could be a labor supply issue. Retail? These are all pretty after-the-fact justifications. 

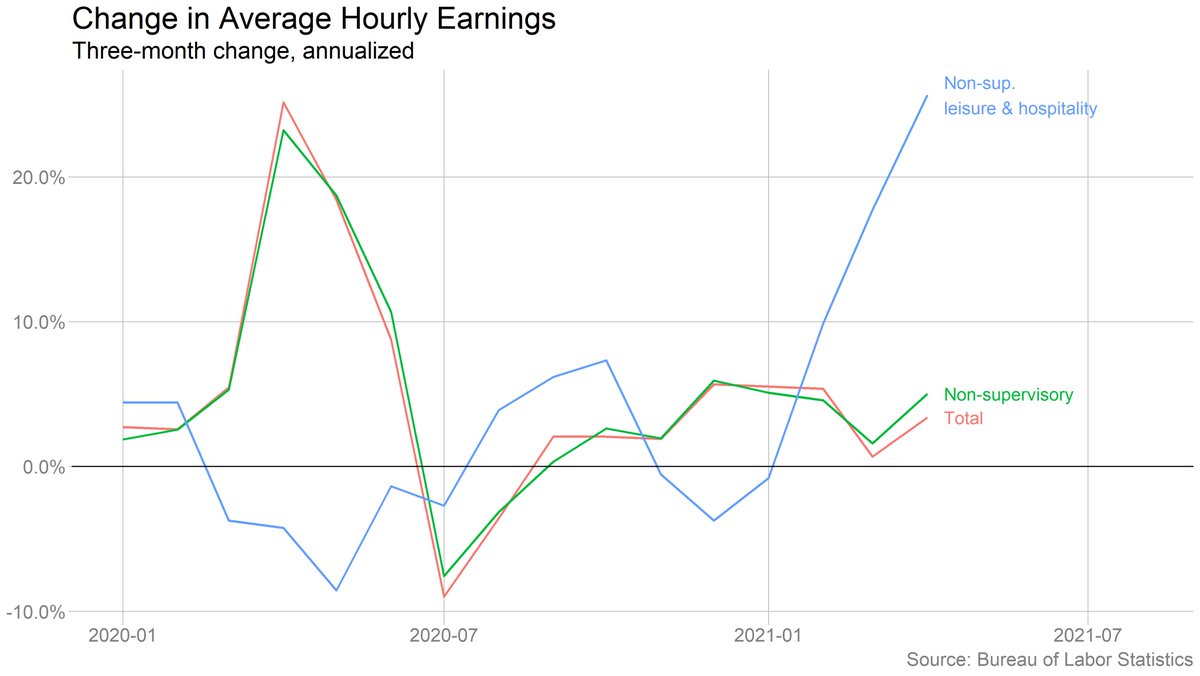
On the other hand, this chart is pretty consistent with a "labor supply" story: Wages are shooting up in leisure and hospitality.
A LOT of caveats here about composition issues, overinterpreting one month of data, etc.
A LOT of caveats here about composition issues, overinterpreting one month of data, etc.
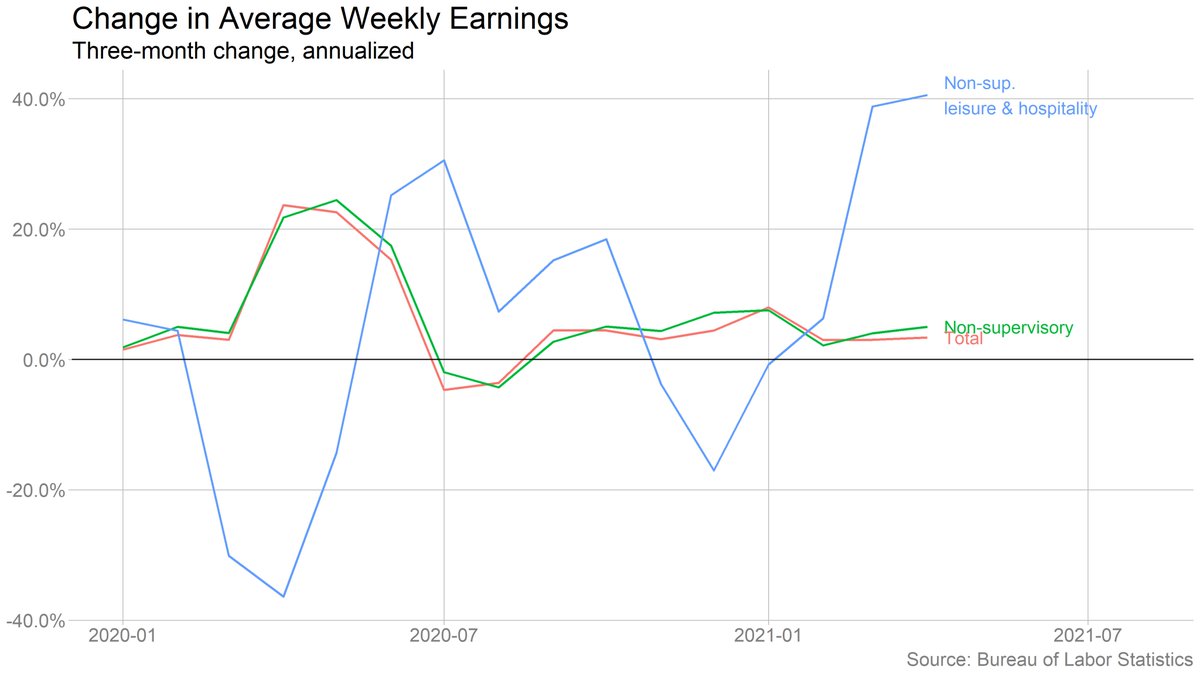
Similar story on weekly earnings, which incorporates hours worked as well as hourly pay. Interesting that the pickup there started a month earlier. (Same caveats apply.) 
Switching over to the household survey for a bit: The unemployment rate actually ticked UP (to 6.1%), and it'd be close to 9% without misclassification and labor force. 
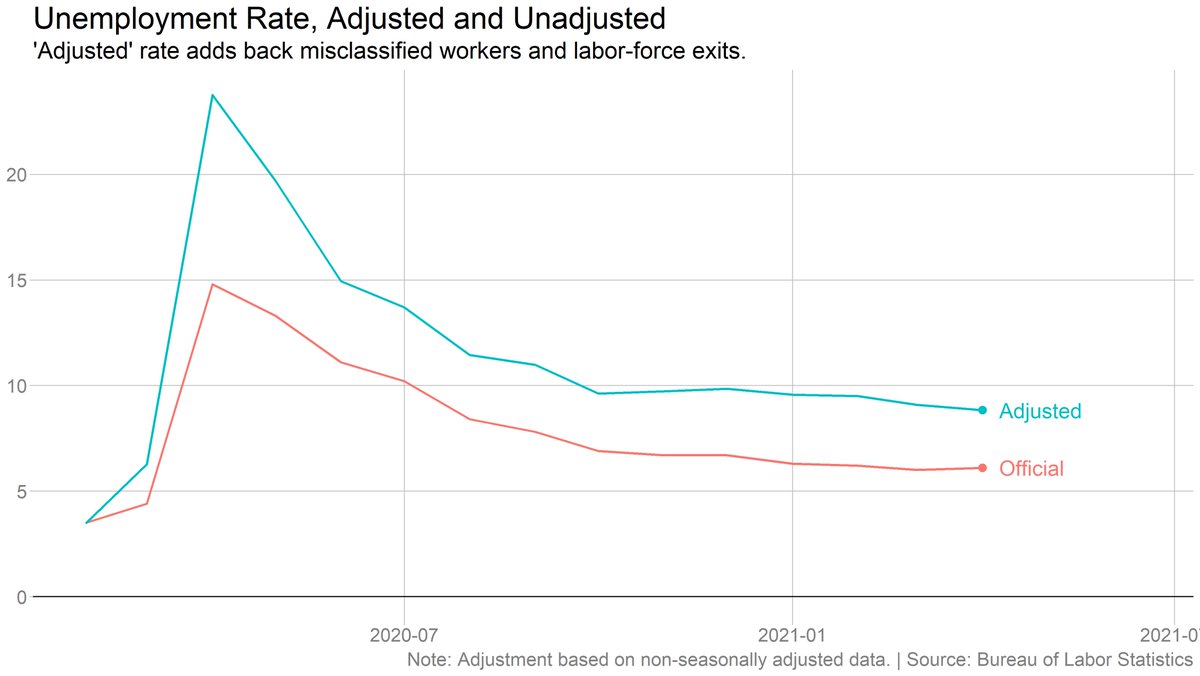
Ordinarily, if labor supply were the big issue, we'd expect to see unemployment coming down quickly but the labor force stagnating, as employers hired up available workers but couldn't attract more.
But the dynamics are funny right now. If workers are reluctant to take jobs (for any reason, not just UI), they might still show up as unemployed since they still want to work under the right circumstances.
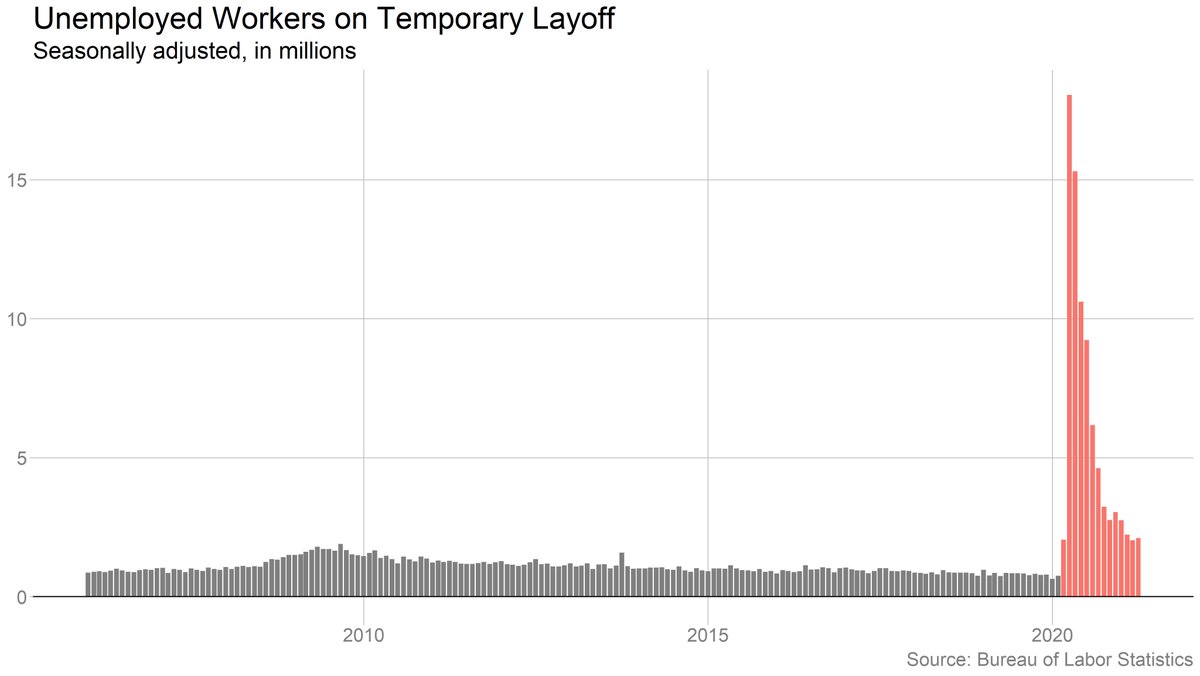
Notable that there are still a lot of people on "temporary layoff." As @nick_bunker has noted, many of these people are not actively searching while they wait for recall. (Whether these layoffs really are temporary remains to be seen.) 
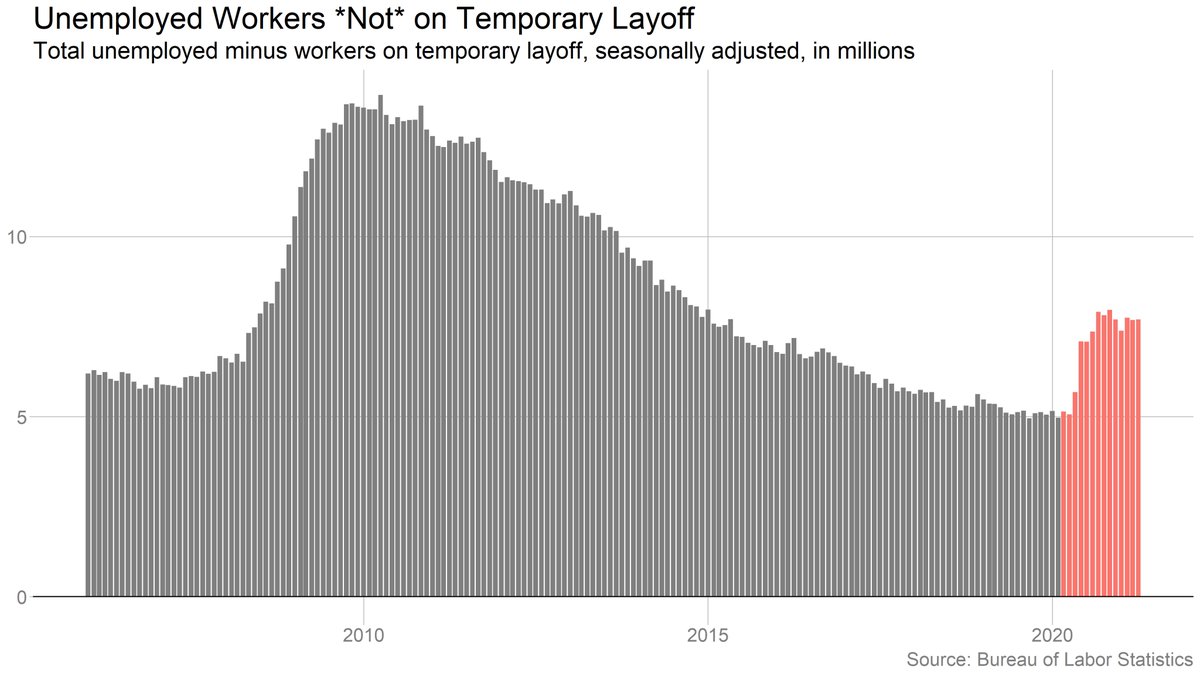
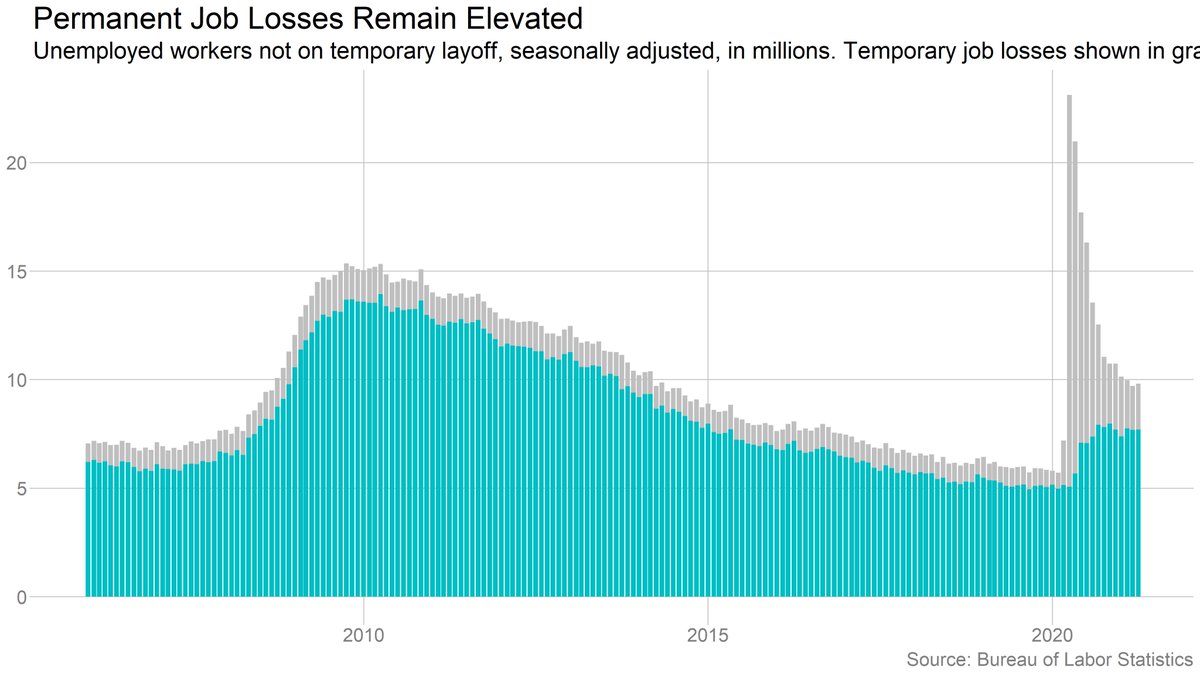
Number of people on permanent layoff (defined here as anyone who's unemployed and NOT on temporary layoff) was basically flat last month. Result is that total unemployment was more or less stagnant. 

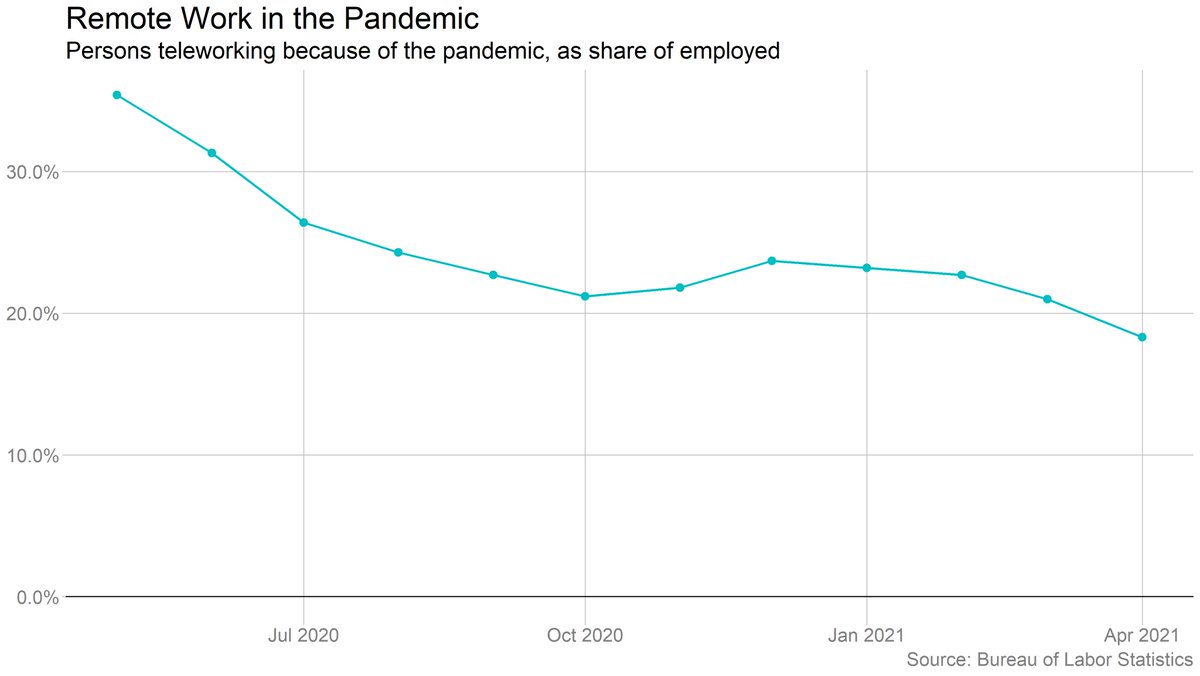
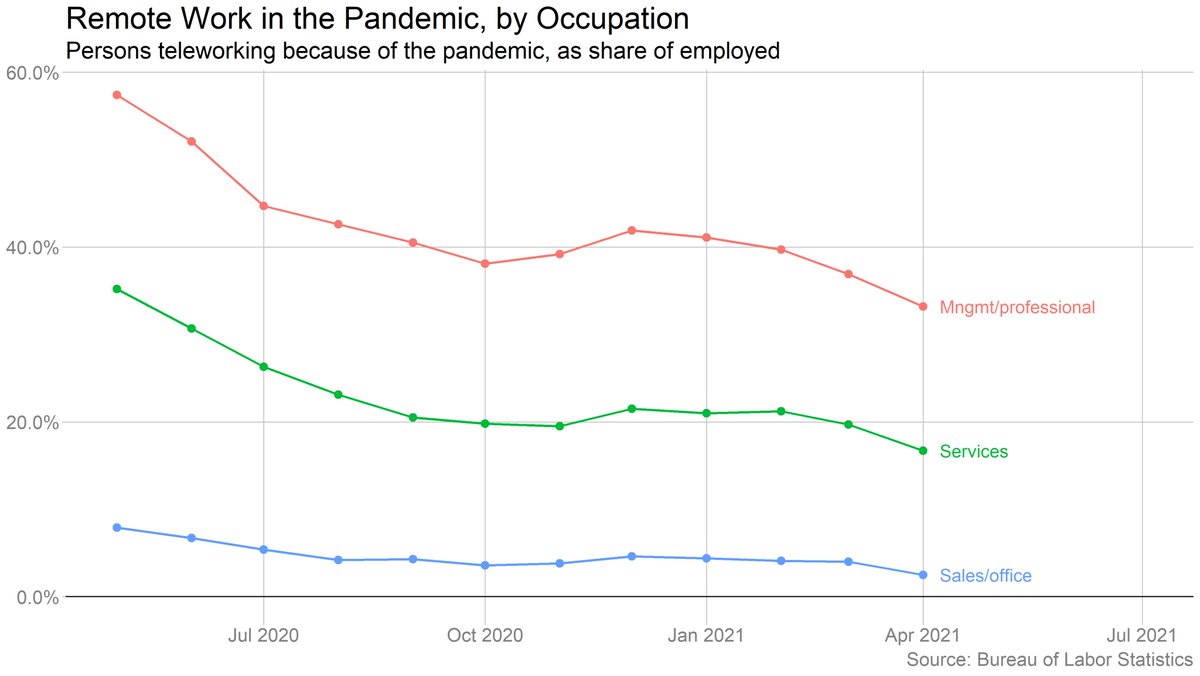
The share of people working from home due to the pandemic fell below 20% in April for the first time. Down to a third of management/professional workers, from over half last spring. Many people, of course, were *never* able to work from home. 

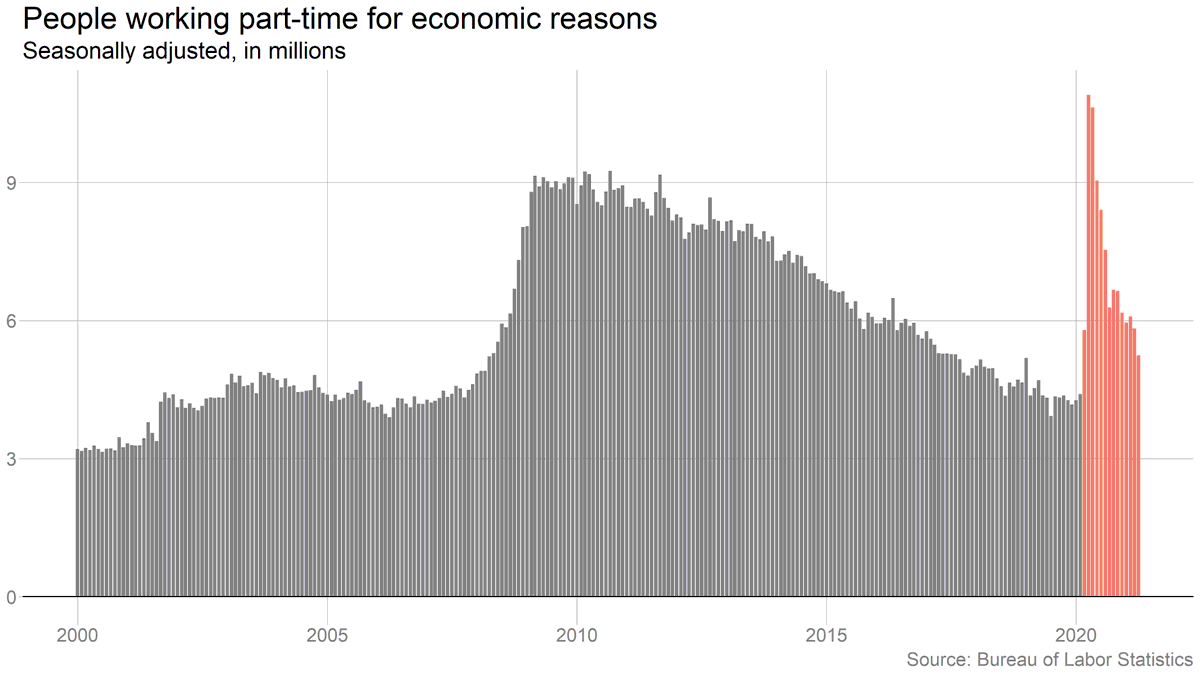
Big drop in involuntary part-time work, which is consistent with the story that employers are struggling to find enough help. But no big increase in overall hours. 
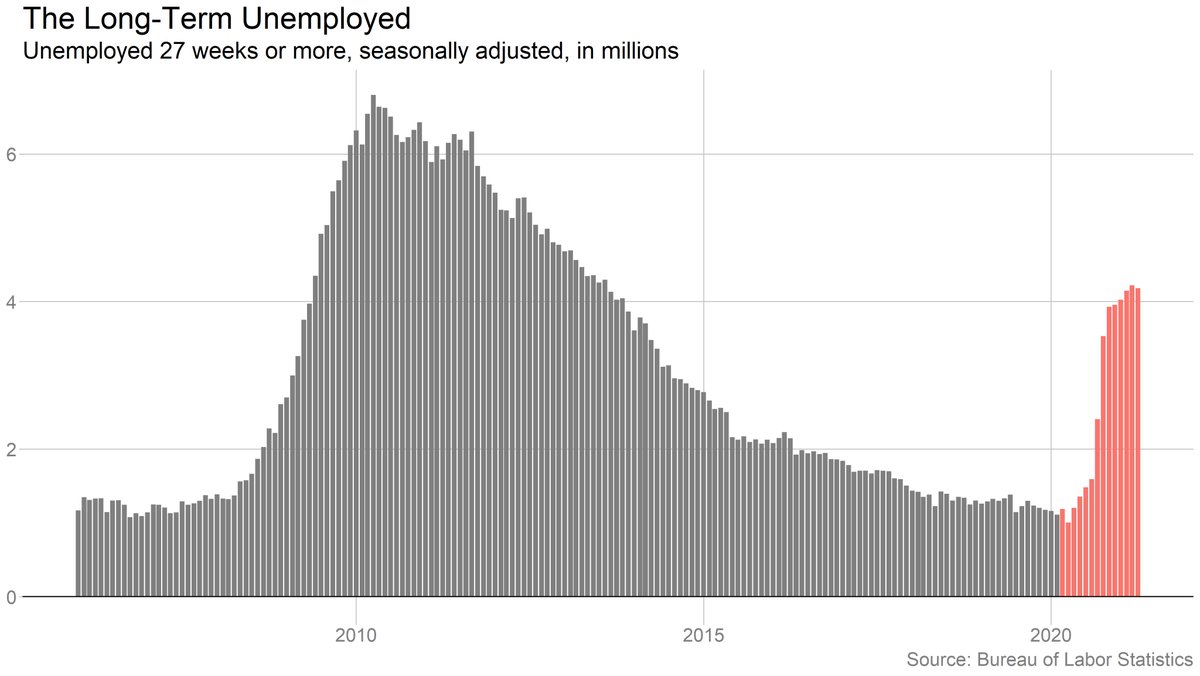
Long-term unemployment was basically flat (down slightly) last month. Still very high relative to pre-pandemic, but well below the last recession. 
• • •
Missing some Tweet in this thread? You can try to
force a refresh

