This cycle is different; the movement of coins to strong holders is unprecedented.

Chart: purple line tracks coins moving between weak and strong hands (running total over 128 days)

Raw data: @glassnode
A few observations regarding the trend towards strong HODLing...

1) No way are we entering a bear market. That's obvious this week from price action, but not so obvious 2 weeks ago when the sky was falling.
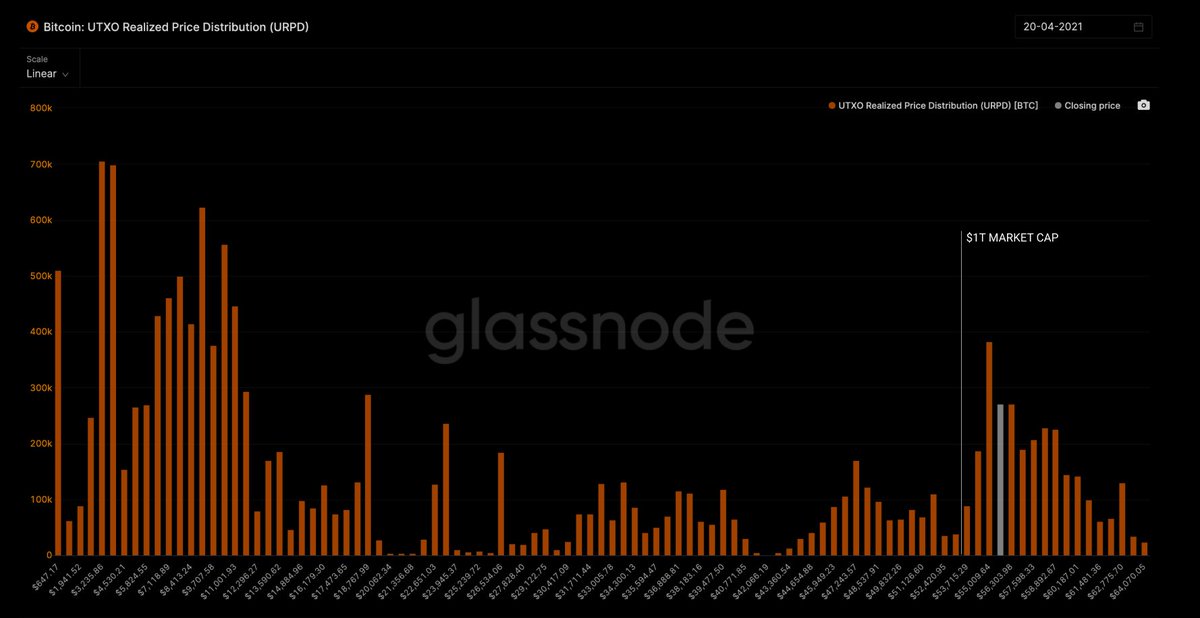
2) Coins moving to corporate treasuries likely making an impact.
3) Grayscale Investment Trust now accounting for 3.5% of the supply only allows for inflows of BTC into cold storage (paper is traded, no coins move).
4) Leverage markets that grew in size from 2017 may have had a part to play also. Lots of coins used moved in order to trade them, with leverage less coins need to move for the same amount of speculation.
5) In the early days of Bitcoin, it was used as a currency (Silkroad era) so makes sense coins moved between more liquid hands.

• • •

Missing some Tweet in this thread? You can try to force a refresh
 

Keep Current with Willy Woo

Willy Woo Profile picture

Stay in touch and get notified when new unrolls are available from this author!

Read all threads

This Thread may be Removed Anytime!

PDF

Twitter may remove this content at anytime! Save it as PDF for later use!

Try unrolling a thread yourself!

how to unroll video
  1. Follow @ThreadReaderApp to mention us!

  2. From a Twitter thread mention us with a keyword "unroll"
@threadreaderapp unroll

Practice here first or read more on our help page!

More from @woonomic

20 Apr
This revisit of lower price has created incredibly strong price validation for Bitcoin about $1T cap. 14% of the supply last moved above $1T cap.

This is a key line in the sand imprinted into BTC's price discovery, an area of immense support.
Anyone thinking we are going into a prolong price correction needs to know about the rate of new users coming into the network per day. We're in the middle of a bull market with a hockey stick of new adoption, especially in the last 2 weeks.
Coins continue to move to very strong holders (the Rick Astleys of this world). And moving at all-time-high rates.
Read 4 tweets
19 Apr
Chinese miners went offline 3hrs into the difficulty adjustment.

The difficulty adjusts every 2 weeks to match the natural increase in hash rate from miners. This keeps block times to a steady 10 mins. If you're going to slow the network down, this is the best window to do so.
9.5hrs into the difficulty adjustment, 9000 BTC was deposited into Binance, this provided enough selling pressure to drop the Bitcoin price below $59k support, forcing the $4.9b of liquidations.
It's an interesting timing of events.

We have 11 more days before the next difficulty adjustment corrects for any loss in miner hash rate. Note the hash rate is already returning to the network.

This is an addendum to my price crash post mortem thread:

Read 4 tweets
18 Apr
#marketupdate, breaking it down, post mortem.

We just saw the single largest 1-day drop in mining hash rate since Nov 2017. The hash rate on the network essentially halved, causing mayhem in BTC price as it crashed.
The power outage in Xinjiang (which powers a significant amount of the BTC mining network) was known before the BTC price crash. Here's local news on 15th April.

translate.google.com/translate?sl=a…
16 April.

9000 BTC was sent into Binance, read that as a sell off of those coins.

I'd note that Binance serves volume from Asia more than the West. It's likely this was sent in from a whale with closer knowledge to happenings in China.
Read 10 tweets
18 Apr
Price and hash rate has always been correlated.

This is BTC price vs today's hash rate collapse (from the Xinjiang blackout).
For those who remember the hash rate collapse of November 2017...
Latest hash rate data by @glassnode, 6hr MA.

Already nearly fully recovered.

BTFD.
Read 4 tweets
31 Mar
A time-lapse map of the price when coins last moved.

Clusters of strong price discovery:
$55k (7% of supply last moved above this)
$47k (15%)

$46.4k is the price I'm modelling that we won't visit again during in this bull market (daily close).
Shear cliffs are areas where coin supply moves steeply upwards in price discovery. (green)

Flows downwards are bear market movements where coins move downwards to lower prices, investors accepting losses (red).
Horizontal bands are dense areas of where coins last moved, hence strong price discovery, acting as support and resistance.
Read 5 tweets
29 Mar
Let report these top fake accounts before more people get scammed 🙏🙌:

@Woonomiic1 (5456)
@Woonomicz (5427)
@woonomic5 (3157)
@Woonoom_ic (2793)
@woonnommic (1199)
@woonom1c (1002)
You're a defender of the scam-trodden by working through these 👏👏:
@_woonomlc (411)
@woonomiiic (340)
@woonimic (234)
@woonomci (219)
@wo0nomic (195)
@woonemic (118)
Willy Woo dedication prize goes to you reporting this bunch 😇😇:

@woonommiic (76)
@woonomiics (54)
@wconomic (27)
@WilliWoonomic (13)
@wonomiic (12)
@woonomic1 (8)
@voonomic11 (6)
@woonomic52 (5)
@woonomjc (4)
@voonomic93 (2)
@woonomic40 (2)
@voonomic20 (2)
Read 5 tweets

Did Thread Reader help you today?

Support us! We are indie developers!


This site is made by just two indie developers on a laptop doing marketing, support and development! Read more about the story.

Become a Premium Member ($3/month or $30/year) and get exclusive features!

Become Premium

Too expensive? Make a small donation by buying us coffee ($5) or help with server cost ($10)

Donate via Paypal Become our Patreon

Thank you for your support!

Follow Us on Twitter!

:(