An update on variants.
Remember the four tests for proceeding with the Roadmap?
Test 4 is "Our assessment of the risks is not fundamentally changed by new Variants of Concern."
The rise in B1617.2 makes it debatable whether we are still meeting this fourth test.
A thread.
1/15
Remember the four tests for proceeding with the Roadmap?
Test 4 is "Our assessment of the risks is not fundamentally changed by new Variants of Concern."
The rise in B1617.2 makes it debatable whether we are still meeting this fourth test.
A thread.
1/15

This data is from the COVID genomics UK consortium (COG) cogconsortium.uk
It shows cumulative sequenced cases of 3 variants of concern (VOCs) P1 ("Brazil"), B13151 ("South Africa") and B1617 ("India").
Cases of the Indian variant have increased significantly recently.
2/15
It shows cumulative sequenced cases of 3 variants of concern (VOCs) P1 ("Brazil"), B13151 ("South Africa") and B1617 ("India").
Cases of the Indian variant have increased significantly recently.
2/15

OK, but cumulative plots always make numbers look larger.
Well, this chart shows cases sequenced each week. "South Africa", "Brazil" and B1617.1 ("India 1") are all staying roughly constant.
B1617.2 ("India 2") looks to be growing exponentially.
3/15
Well, this chart shows cases sequenced each week. "South Africa", "Brazil" and B1617.1 ("India 1") are all staying roughly constant.
B1617.2 ("India 2") looks to be growing exponentially.
3/15

As a proportion of all variants sequenced (including our currently dominant B117 ("Kent") strain), B1617.2 ("India 2") is up over 13%, while other variants remain below 2%.
4/15
4/15

OK, but couldn't these rises be due to incoming travellers or surge testing?
Well, the Sanger Institute releases data which removes cases linked to travel and surge testing (covid19.sanger.ac.uk/downloads ).
The numbers are smaller, but rise in numbers of B1617.2 (red) is still clear.
Well, the Sanger Institute releases data which removes cases linked to travel and surge testing (covid19.sanger.ac.uk/downloads ).
The numbers are smaller, but rise in numbers of B1617.2 (red) is still clear.

As a percent of all sequenced cases the rise is even more pronounced, reflecting the fact that B1617.2 is gaining prominence in a situation in which other variants (even B117 ("Kent")) are flat or falling.
6/15
6/15

If these cases were primarily due to travel, then adding India to the red list should have dramatically decreased the number of sequenced cases.
Data last night's from PHE suggests that this is not the case.
The proportion of cases linked to travel (blue) is decreasing.
7/15
Data last night's from PHE suggests that this is not the case.
The proportion of cases linked to travel (blue) is decreasing.
7/15

Regionally (Sanger data), B1617 ("India") accounts for 25% of sequenced cases in London and over 20% of sequenced cases in the Northwest.
Yorkshire and Humber, West Midlands and the North East still have relatively lower levels.
8/15
Yorkshire and Humber, West Midlands and the North East still have relatively lower levels.
8/15

This is corroborated by data released by PHE looking at S-gene dropout in some PCR tests - distinguishing B117 ("Kent") from other variants.
This proxy doesn't rely on sequencing so numbers are bigger.
These charts show B117 (purple) has been dominant in all regions ...
9/15
This proxy doesn't rely on sequencing so numbers are bigger.
These charts show B117 (purple) has been dominant in all regions ...
9/15

... until recently when variants without the S-gene drop out have started to rise.
Although less definitive, this proxy is a much more up-to-date measure than sequencing (which is slow) and suggests non-B117 variants (green) may already be dominant in some areas (e.g. London, NW)
Although less definitive, this proxy is a much more up-to-date measure than sequencing (which is slow) and suggests non-B117 variants (green) may already be dominant in some areas (e.g. London, NW)
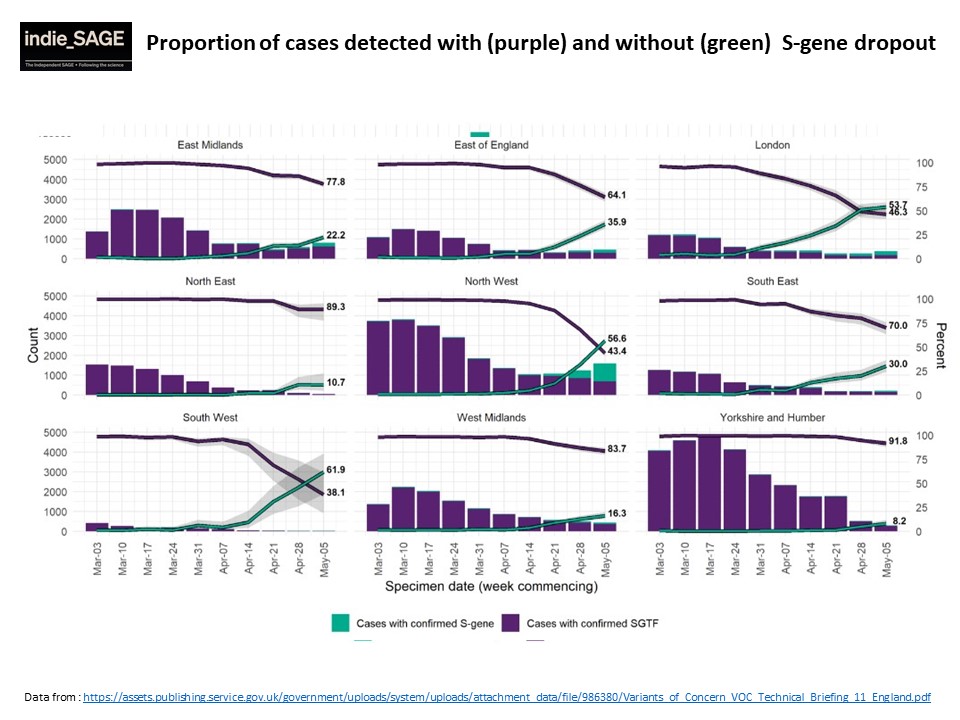
That the proxy also agrees with sequencing in the regions in which B1617.2 is dominant is further supporting evidence.
Although we are not completely sure yet, the rises in B1617.2 when other variants are falling suggests higher transmissibility.
11/15
Although we are not completely sure yet, the rises in B1617.2 when other variants are falling suggests higher transmissibility.
11/15
We don't yet have good evidence to suggest immune evasion (or otherwise) of B1617.2.
But, significantly increased transmissibility (30-40%) alone would be bad news and could lead more hospitalisations than the first wave, according to SAGE modelling.
assets.publishing.service.gov.uk/government/upl…
12/15
But, significantly increased transmissibility (30-40%) alone would be bad news and could lead more hospitalisations than the first wave, according to SAGE modelling.
assets.publishing.service.gov.uk/government/upl…
12/15
Modelling from the University of Warwick group suggests if there were also some degree of immune evasion B1617.2 "could generate outbreaks larger than the second wave".
13/15
13/15

Of course, these models are subject to lots of assumptions and uncertainty and you should read the assumptions to make up your mind about how much you trust the outputs.
assets.publishing.service.gov.uk/government/upl…
14/15
assets.publishing.service.gov.uk/government/upl…
14/15
Now you've seen the evidence, I'll leave you to make up you own mind about whether we are meeting
Test 4.
Is your assessment of the risks is fundamentally changed by new Variants of Concern?
\ENDS
Test 4.
Is your assessment of the risks is fundamentally changed by new Variants of Concern?
\ENDS
• • •
Missing some Tweet in this thread? You can try to
force a refresh